In my previous blogs, I’ve been hammering Fabric with data from some different angles. Either with the Copy dataflows, notebooks, Pipelines, Data Warehouse SQL scripts or in PowerBI.
This time, I’m going to make the dataflow Gen2 work for it’s money.
As usual, I’m using the F2 capacity as it’s the one that should break the easiest. It’s also the cheapest one to run tests against and, as the capacity calculation isn’t dependent on the SKU (Stock Keeping Unit), you can easily translate to find out which capacity SKU will fit the workload. Remember that your workload will differ from mine and the one shown in this blog. These tests are a comparison between the different offerings, something you could do for yourself. In your work, your skills (and those of your co-workers) will be a major driver towards an option. And this even offers the chance to learn something new!
As a disclaimer, this blog is not intended to show best practices, the intention is to help you identify overuse of the capacity and the effects this has. To demonstrate, I’m using an F2 capacity far beyond the limits. Why? Because it’s the easiest way to show the effects. And, it shows that even the F2 does have processing power.
Setup
To make things easy, and give the dataflow a fighting chance, I’m using the delta parquet files that are already in a Lakehouse. From a personal point of view, these are the go-to option to ingest data into the raw layer of your Onelake. Only if the pipelines can’t reach the source data (for instance when you need a secure connection outside of Azure and your only option is the data gateway), then use the pipeline gen2 to ingest data. Be aware though that some modification to the source data can occur (like changing the data type).
Use cases
Why would you want to use the dataflow gen2? It’s an important question as it will drive your selection on tools to use for your data estate. If you’re coming from a PowerBI world, using the dataflows might be somewhat familiar as many people have been building processes to read the raw data, transform it and offer it to the front-end of PowerBI without using any other tool. This works fine, even though it’s hard to share your code with other users and have some central maintenance. With the dataflow gen2, that issue is mitigated as the dataflow can be centrally managed and maintained. You can use it to extract data from source systems using the on premises data gateway and model data.
When you create a new flow, there’s a huge list of sources available to read data from.

The list goes on and on and to be honest, with the dataflow Gen2, you’ve got the most choices of source systems to read data from. All the other offerings have less predefined connectors available. Besides these connectors, you can of course leverage the on-premises data gateway.
If you like working with a GUI, again the dataflow gen2 is a very good place to start. You can click, drag, drop all the steps you want to take to ingest, cleanse and model your data.
My usual question is, does it perform and what happens when it doesn’t?
Dataflow Gen2
The first test is nothing more than ingesting data. Read it from a source and writing to a destination. Granted, work more suited for a copy data pipeline but let’s just see what happens. Looking at all the other processes, how hard can it be, right?
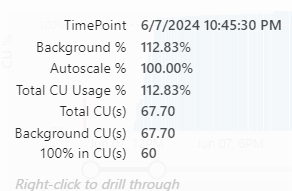
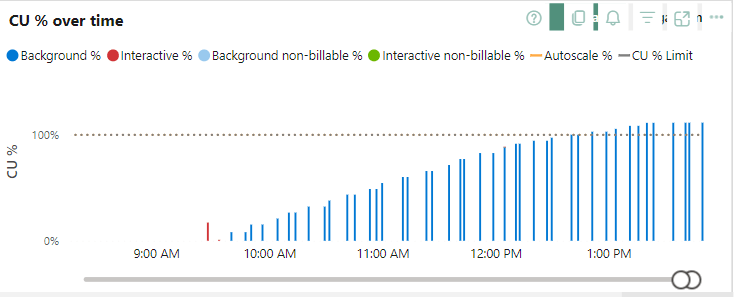
The utilisation graph showed some ‘spectacular’ usage.

Even though a little over 100%, this went on for quite some time.
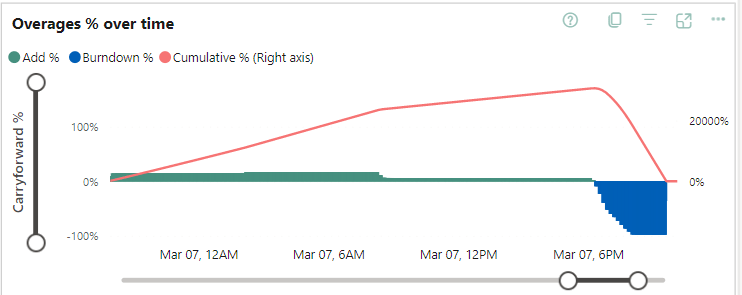
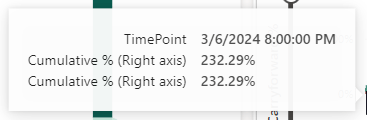
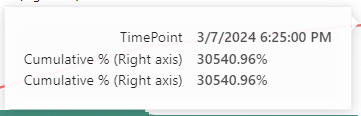
Was it really angry with me? Let’s check out the overages (the graph that shows the bursting and smoothing effects).

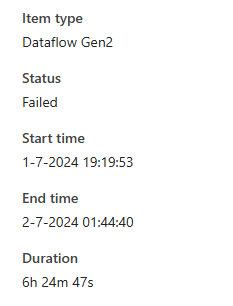
Well, yes, it was. The overage was building up a lot and made short work of my capacity. The thing to note is that the pipeline only ran for a little over an hour (according to the refresh history).
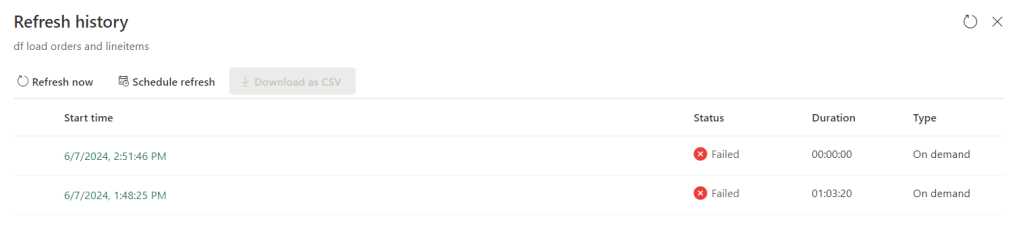
The fact that you’re seeing a duplicate registration is something that has been mentioned to the program team; most likely something happening in the communication between the front end and the back end. In any case, the pipeline failed after an hour and three minutes but the capacity smoothed out the work over 24 hours. With the added effect that after 1 hour, the capacity reported an error.
The error message:
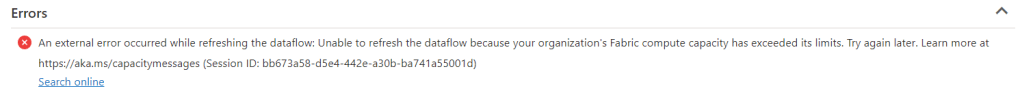
I think this shouldn’t be reported as an error as it isn’t really an error. It’s more like a maintenance message; you did more than we could cope with, please wait until the capacity has cooled down, has been scaled up or restarted. If you agree, you can look and vote for this idea.
Coming back to the ingestion of quite a lot of data, this relatively easy task can’t be accomplished with an F2. And it will tell you. So when you’re developing processes in the dataflow Gen2 experience, keep a sharp eye on the metrics to see if the capacity still fits your workload, because it can go off the scale quite quickly.
Now, the question is, will it work with an F4. Because the usage was just a little over 100%, the capacity units needed a little over the 60 available with the F2 so let’s double those and see if this will work with just a little more power available.
After waiting about four hours, this was the result.
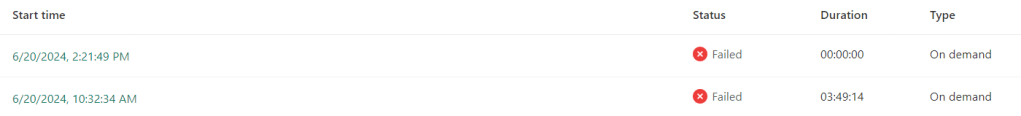
The error message? Again, ran out of capacity. It just took a lot longer.
What you’re seeing here is that the load registered from the dataflow gen2 is slowly growing. It starts quite small and keeps increasing. Now the hard thing is that I can’t see what it has done and what it hasn’t done. It’s a bit of a black box that succeeds or fails. And with just the mention “you ran out of capacity”, it makes it very hard to debug.
So, let’s run it against an F64, just to see if it can complete at all.
I did get a different error though.

“raw_orders_WriteToDataDestination: Mashup Exception Data Source Error Couldn’t refresh the entity because of an issue with the mashup document MashupException.Error: DataSource.Error: Error in comitting version., Underlying error: conflicting metadata change Details: Reason = DataSource.Error;Message = conflicting metadata change;Message.Format = conflicting metadata change;Microsoft.Data.Mashup.Error.Context = User”
Yup, I have no idea either what’s happening here. At least I found out the capacity needed to run this dataflow. The more baffling part being that there is actual data in the orders table.
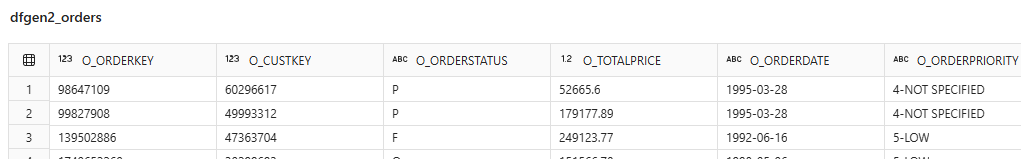
Let’s do a quick check and see how many rows were ingested.

536,870,911 rows were ingested before the error popped up. Even though the schema is quite stable and the data doesn’t change much. There are around a billion rows in this table, it stranded a little over half way and needed a little over six hours to process these 536 million rows. If this is a linear process, moving all the data would have taken 12 hours and then the 5 billion rows table was next. If that one would run at the same speed, 60 hours later we might have all the data. Copied from one lakehouse table to another one.
Moving on, as the error is different, I should have some information on my capacity usage.

My capacity is humming along at 394 CU’s, a little under the limit of the F16 capacity (480 CU’s). This level kept running for around 26 hours
My overages are empty so this fits nicely into the capacity and the smoothing algorithm is keeping my capacity nice and active without seriously hammering it. Albeit this being the F64 capacity.
Smaller tables
Ok, so the big ones do not work, let’s see if a smaller dataset will pass through.
This time I choose a table of 95 million rows, just to see what happens with a smaller dataset.
This one completed in 31 minutes. Judging from the CU graph, it ‘only’ took around 46 CU’s to process this data, even though it’s smoothed out over a long period of time (again about 24 hours). I found that it took almost 24 hours for this dataflow to show up in my items list.
Joining tables
In earlier testing, I decided it might be a fun plan to see if I could join two two tables into one huge table, in this case orders and line items. The ones that are processed in minutes if you’re using a spark notebook.
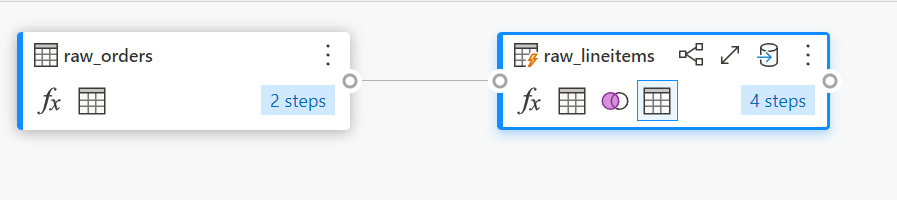
This test has a quite simple setup. Read the Orders table, join the OrderLines table and try to add a column with the year of the order. Finally, write the data out to the Lakehouse into a new table.
Staging
Now, my personal preference is to disable staging for the simple reason it’s a time sink. It reads the data, saves it in the staging lakehouse or warehouse, reads it again and then transforms it into a table. As I’m not doing anything spectacular at all, I’m sure I don’t need the staging.
Running the Dataflow
So let’s run this beast and see what happens!

Well, that’s not good. After almost 2 hours, the engine had enough and kicked the flow out. Now the question is, what happens with the capacity usage?
The overage kept running for about 22 hours, just building up.
Again, a lot of waiting to be able to use the capacity again (or scale it up to speed up the burn down over overusage or pause and resume the capacity to add the cost over overusage to your monthly bill). But this just doesn’t work.
Using Fast Copy
After testing this, I reached out to Microsoft to share my findings and they suggested I’d use the fast copy option; a feature in preview but it might alleviate some of the pain. I had forgotten about that option but to be fair, I had to give it a try.
More information can be found (including current limitations) by following this link.
You can find the fast copy option when you open your dataflow.

First, you click on options in the main ribbon. In the pane that opens, find the option scale. In the window on the right, click on the checkbox button to allow use of fast copy connectors.
Save your dataflow, publish it and run to check the results.
The first thing I noticed was that the capacity usage dropped. And not a little bit either. For this flow, a whopping 2.8 was registered, a usage that after about 10 minutes rose to 6.2 and after that to 9.3 CU’s. That’s very low. Besides being cheaper than the orginal, I was hoping the fast option would also mean it being quicker. And it was, after setting the Require fast copy setting on the query. It ran in 8 minutes and 15 seconds, compared to the 31 minutes without.
So let’s try the big one again with billions of rows. Again with the fast copy enabled and enforced on the source. The Microsoft documentation isn’t very clear about this but in my experience, you need to require (or enforce) this to get the most from this setting.

Now we get into an area where there’s a vast difference. The dataflow Gen2 finished in 10 minutes. Whereas the non Fast Copy one failed after six hours. Read that again, 10 minutes success versus 6 hours failure.
Wow.


These screenshots are purely to show you there nothing up my sleeve. If you watch closely, it does say 5 billion and 1 billion rows processed. 1 Billion in a little under 6 minutes, the 5 billion in 10 minutes.

The entire dataflow took 10 minutes, meaning that it processed both tables in parallel as well.
I’m impressed, seriously! And with that, it took around 78 CU’s, compared to the 394 it took without using the fast copy option.
With this knowledge, let’s retry the process to join orders and line items and add a column. Instead of failing, now I’m expecting results!

Sadly adding a column isn’t allowed; let’s see if I’m allowed to join tables as combining files is allowed. And again, the same error.
For my line of work, it means that I’ve found a turbo button for ingesting data (assuming the source is supported). But for cleansing and modelling, the turbo setting doesn’t work and you’ll need to find another way which is, in my opinion, a notebook.
Concluding
I really like the concept of the dataflow Gen2. I really do as it offers a GUI to build your data flow which is something that can lower the bar for new users who are used to GUI based ETL software. It’s an easy transition for people used to working with PowerBI. It has a lot of built-in connectors to a plethora of datasources.
What it should add is a default for using fast copy when it detects the source is supported and the steps in your dataflow are supported. Because in these scenario’s it is a very serious contender. The processing speed goes up, the capacity usage falls down (even though it’s smoothed over a longer period of time).
When you are in the cleansing or modelling phase, you won’t benefit (yet) from this “turbo setting” but maybe it will come in the future. If that happens, it will be a very serious contender for a lot of other GUI based ETL/ELT tools.

2 thoughts on “Microsoft Fabric Dataflow Gen2: In-depth Performance Evaluation and Capacity Insights”