Microsoft Fabric really is a Swiss army knife when it comes to its possibilities. Not only capable of hosting your BI information which is usually loaded at night and analysed during working hours but it can also process real time information. Let’s dig into that some more!
Data Fabric architecture
Before we go all nerdy and techy, a little context. Microsoft Fabric isn’t a name that Microsoft just came up with. I’ve got a very strong suspicion the name is based on the general architecture of a data fabric. You can either read up on that in the Deciphering data architectures book from James Serra or read more online. By and large, the difference between a modern data warehouse (the layered architecture where data is processed from your source to your star model) and a data fabric is the real time component. Streaming data from, for example, IoT devices or systems constantly pushing out data is ingested in the engine, processed and ready for analysis in a very short time. There are a lot of things you can do with this, but let’s dig into how it works in Microsoft Fabric.
Finding the resources
On the Fabric Portal, you have to look out for this
The icon is in red which makes it look dangerous and it might very well be very dangerous. But what’s the data engineers life without a little risk, let’s go!
When you click on this icon, you get a whole lot of new icons.
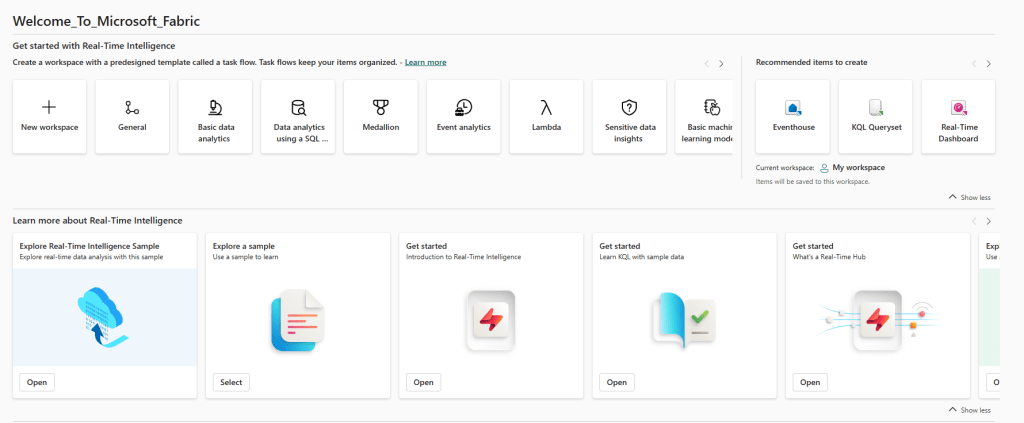
There is a lot to choose from and at first sight, it’s really intimidating. Maybe it’s just me, but everytime I see the Lamdba icon, I think about the catalytic converter in my car and when it shows up, it’s usually bad news. And expensive.
New workspace
In my case, I’m going to start with creating a new workspace by clicking the icon in the top right corner.
After creating the workspace, I get a clean working surface to start with.
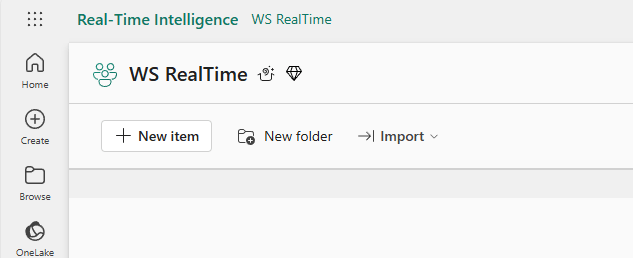
When you click on New item, you get the massive list of options to get data.
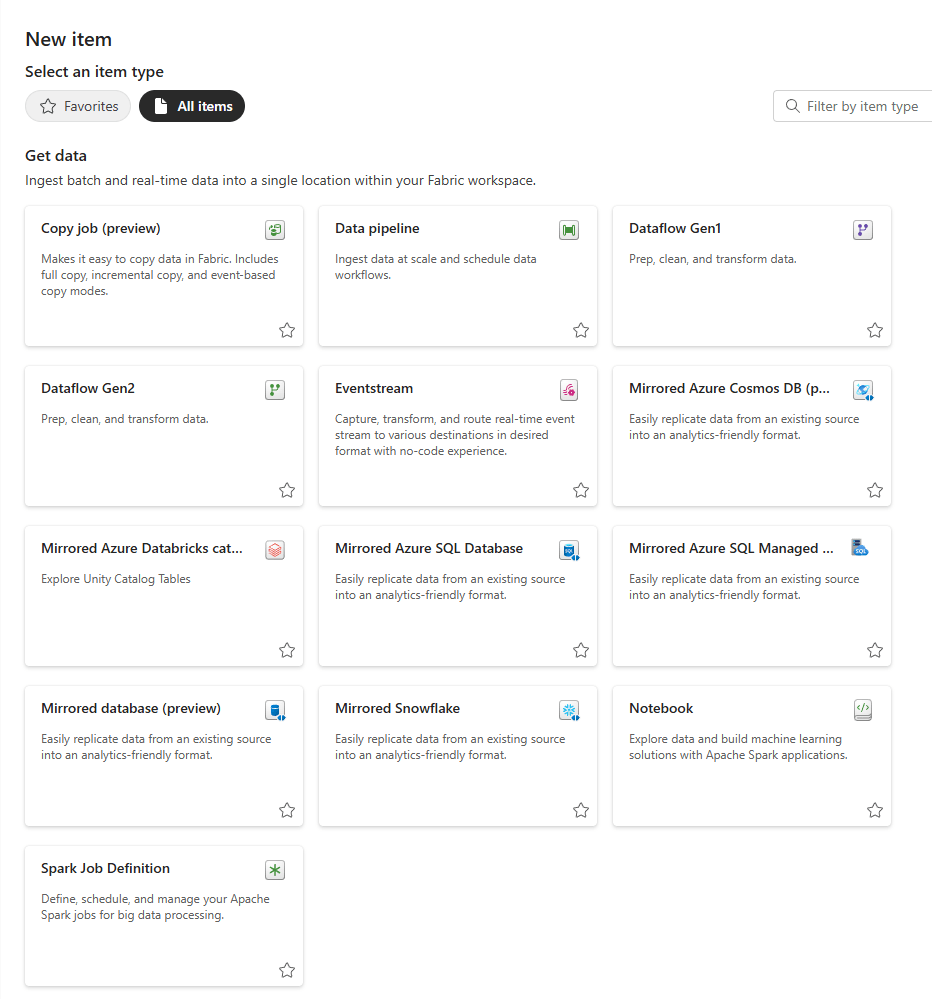
Create the Eventstream
In this case, let’s choose the Eventstream.
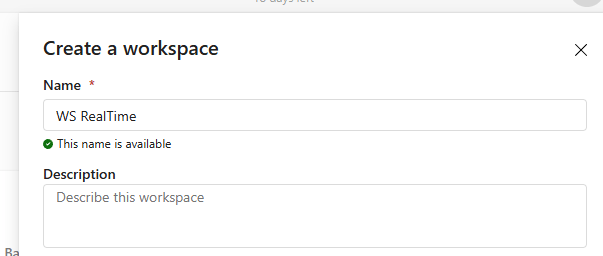
After a few seconds where Microsoft Fabric realises it has a lot of work ahead of it, it will show you the pop-up window where you can choose a name.
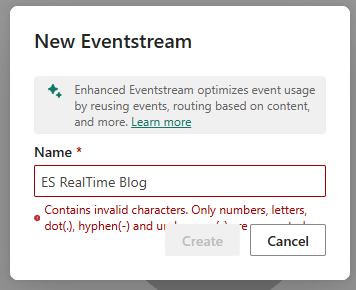
Ok, a little pet peeve of mine, why aren’t spaces allowed? Earlier we saw that underscores are used in the main portal of Fabric but using them here feels weird. But let’s use underscores to remove the error message.
With the error fixed, you’ll see a new screen where you can go wild, or start easy with some sample things.

Sample data
In this case, the choice is made to use sample data. Now, for those of you who have either seen the video by Valerie or who are going to look at it, I’ve chosen a different sample data set. On purpose even so you get to see different sets of data being processed. Whereas Valerie chose the bikes, I’ve gone for the stock market.
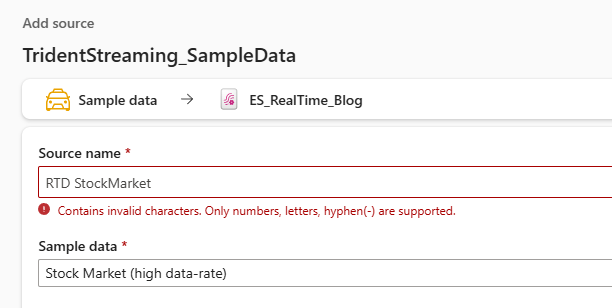
Again the message that I can’t use spaces in the name, but now underscores aren’t supported either. Ah well.
When you click add, all of a sudden a lot happens!
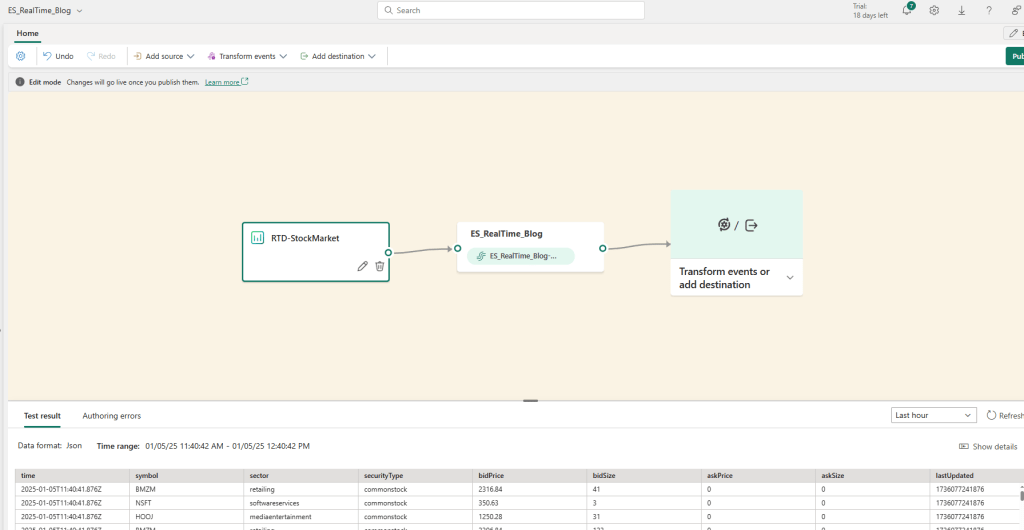
Not only did Fabric create a source, but it also added the stream. This way data can start finding it’s way into my Fabric environment. But this is just a hollow solution, by which I mean the data is visible but not stored or changed in any way.
The easy way out is to add a data destination and write the data. But that option will leave you with some work when you want to report on the data. There might be columns that you don’t need in your report. Or you might miss columns.
Data transformation
When you click on the most right icon, you’ll get a list of options.
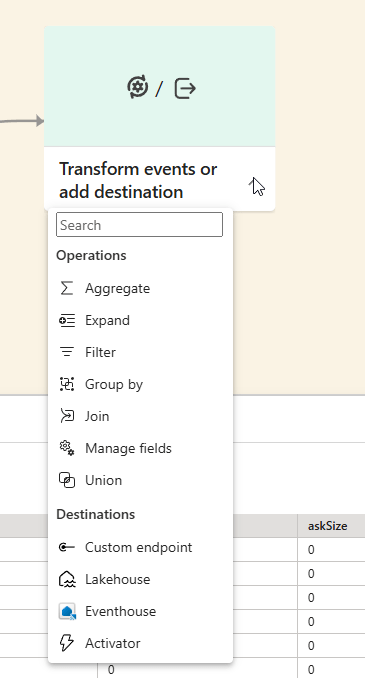
There are many things to choose from. The operations allow you to mildly modify the data or join it with other streams, the destinations speak for themselves.
In this case, let’s see what happens when we select Manage fields.

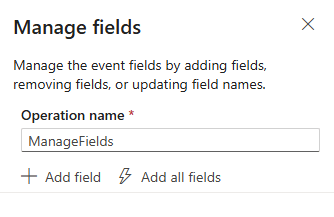
Manage fields
What you need to do here is click on the pen icon to show the editor where you can select all the fields or add specific ones. A field is also known as a column in the structured data field.
When you click add all fields, this happens:
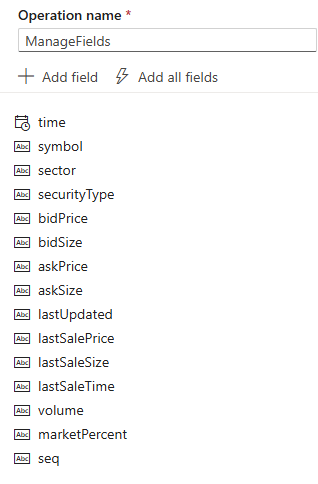
It looks like valid data so I’ll keep it all in. But I want an extra column with the timestamp of when the data was loaded into my destination.
When you click Add field and then the dropdown from select field, you can see the following list.

The imported schema will show you the columns from the source. The columns have checkboxes helping you to quickly get to columns you need for your specific needs.
In my case, I’m going for the second option.
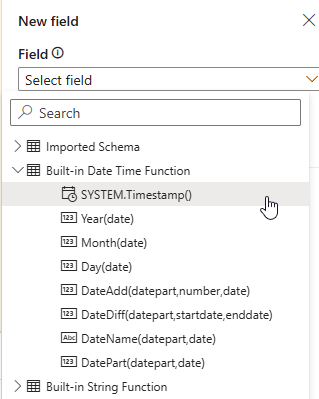
This option will create the timestamp of when the data was loaded.

Now I’ve added my own column showing when the data was loaded. And, no complaints about using a space. Finally, I’m going to add a column where I want to multiply the bidprice and bidsize to create the column bidvalue. Not sure if it makes a lot of sense from a financial point of view, but let’s not get distracted by reality.

That’s a pity, I can’t do multiplications from these options. So this is something you need to do in following steps preparing your data for reporting.
As a final step, I’m going to rename the ManageFields operation name to something that makes more sense or, even better, describes what is being done.
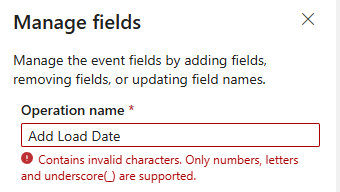
Ok well. This time no spaces, no hyphens but underscores?
Moving on
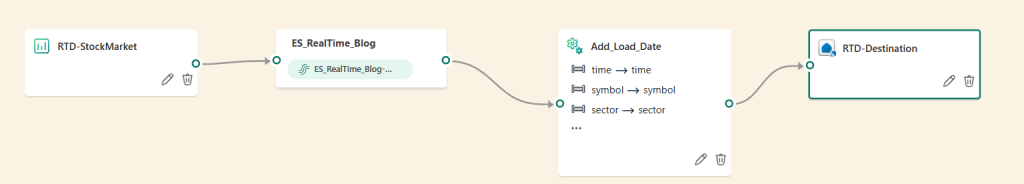
Now, with the load date added, the process looks like this:
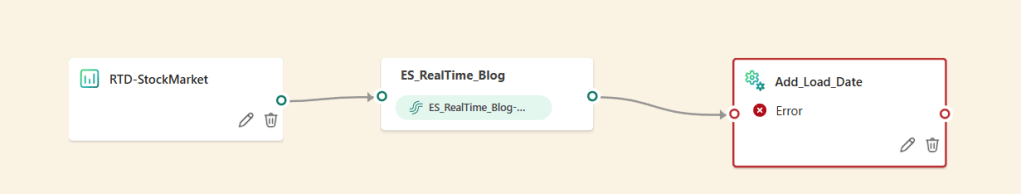
It still shows an error? Why?
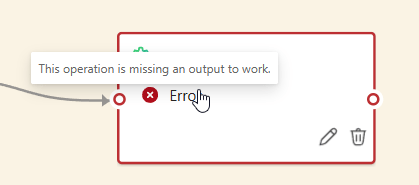
Alright, this one makes sense. Without an output, the steps is meaningless.
Add the output
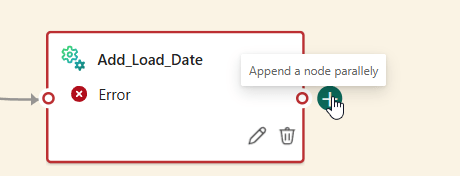
When you hover next to the last operation, you get a plus sign with a message about a parallel node. When you click on it, this shows up:
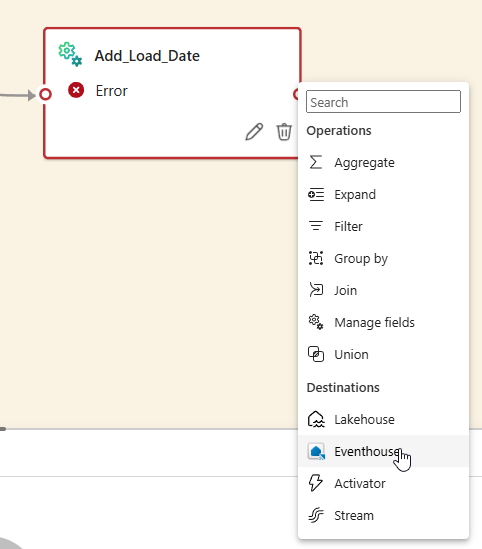
In this case, I’m going to create an Eventhouse. Why not a Lakehouse? Well, real time data is usually described as being time series data. This means the data is based on time, every record has fields all bound to a specific moment in time. When you want to do analysis, usually you’re filtering on one or more datetime columns. In this case, the Eventhouse makes more sense as this is built for just that kind of data. You’ll need to use KQL (Kusto Query Language) to get the data out (another new skill to learn!) and you will discover it’s quite fast. The Azure Log Analytics workspaces use the same technology under the hood.
Creating the eventhouse
When you click on the eventhouse icon, this happens.

Now my previous error has been solved, now I’m left with a warning that some set-up is required. Also, remember that the plus icon mentioned something about a parallel node. I’d argue that this is a serial node as it will only be leveraged after the previous one has finished.
Set-up
When you click on the pen icon to set-up your Eventhouse, the following window comes up.
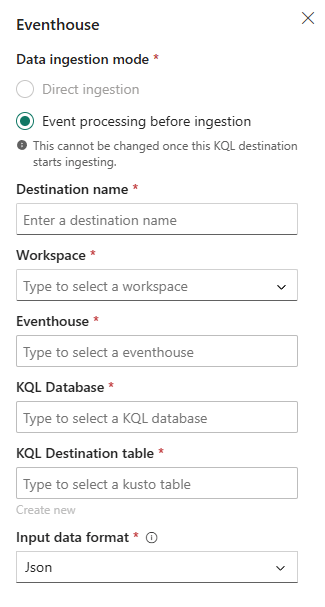
Let’s work through the steps.
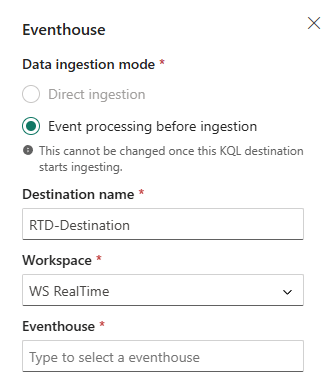
I can create the destination name and select the name of the Workspace. But as it doesn’t have an Eventhouse at the ready, the rest of the steps fail. Quite simply, you can’t create an eventhouse from this view.
Create the event house
To make sure I don’t lose my work, I opened a new tab in my browser and opened the Realtime workspace.

Part of my work is here, but let’s add the Eventhouse.

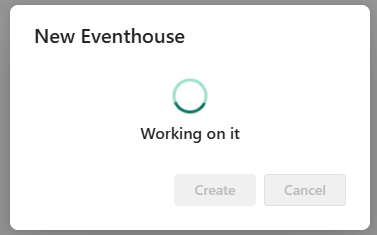
Click on the item and give the thing a name.

Fix the name and creation starts.
When creation has finished, you’ll see a nice dashboard showing what’s happening.
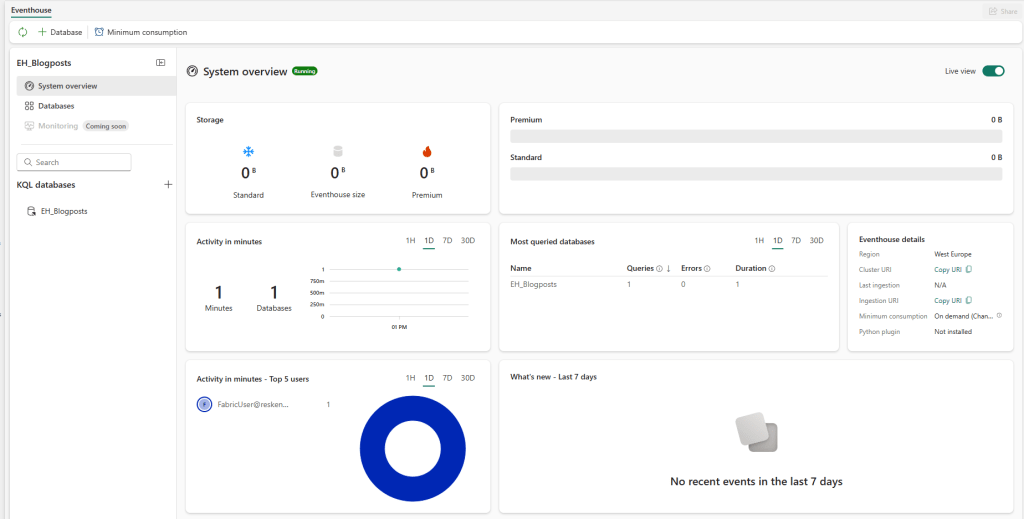
I have to say, I really like this overview!
Back to the event stream
Going back to my other tab where my event stream is still patiently waiting, I can now select my Eventhouse.

This makes the following steps a lot easier.
I can select the database as well (it’s the one automatically created) and now I can create the KQL destination table.
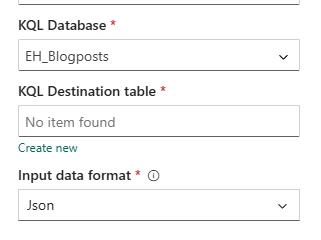
When you click on create new, you get the option to give it a name.
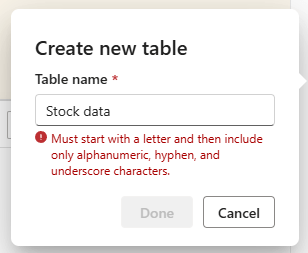
The entire list looks like this.
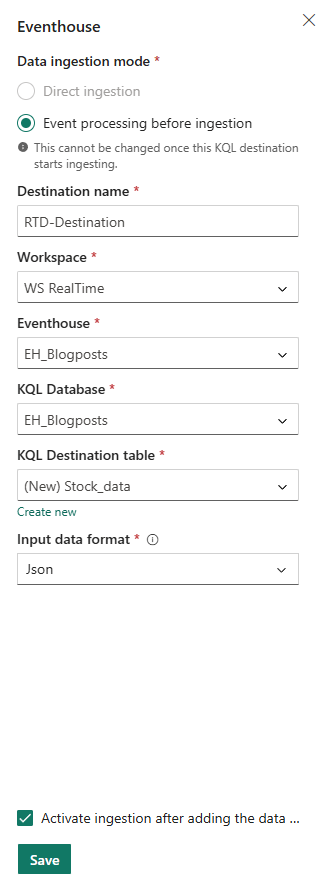
Final result
Now my process looks like this.
All that’s left to do is click publish in the top right corner and it should start running.
Now all you need to do is wait for the next set of data to be published to see it streaming into your Eventhouse.
Video
As mentioned before, Valerie created a video on this subject as well, you can find that one here.
Learning more
If you want to learn more from experienced people, try and find a precon at a data event. People like Devang Shah, Frank Geisler, Matt Gordon, Johan Ludvig Brattas and Brian Bonk are helping you out by offering a day of training. I’ve opted to not include links as these get out of date quite quickly.
Final thoughts
Basically, it’s not the most challenging work to create an event stream and load your data into an Eventhouse. Luckily, there aren’t too many buttons you need to touch or fiddle with. The naming is weird though, every object has different requirements and in the end I’d advise you to find a convention that doesn’t rely on spaces but something like camelCasing to keep your naming readable.

2 thoughts on “DP-700 training: exploring event streams”