Let’s start this blog with a personal opinion: I love windowing functions.
Sounds like a good start of this post? Cool, let’s keep going.
What is a windowing function?
There’s a lot you can read about it, but in short it comes down to creating a subset in your query result where you apply a specific function. A simple example is generating a running sum. The running sum can be calculated over the entire resultset but also on a subset of your data, for instance a running sum over each location or area.
In my experience, windowing functions are easy to write and offer a lot of functionality and don’t hamper performance too much.
Windowing in SQL
Let’s start with how it works in the beloved SQL Server. Depending on your version (SQL 2022 or SQL Server 2019 and earlier) there are different ways to write a windowing function.
When you’re using SQL Server 2019 or earlier, you can use the windowing function in the SELECT statement of your query. Beginning with SQL Server 2022, you have the option to declare the windowing function in your query and reference to that function in your SELECT.
If you want to learn more about this, I’d suggest you dig into this article on the Microsoft Learn website. With all the other good stuff on the left, you’ll be having fun for the next hour or so.
Windowing in Real Time analytics
When you dig into Real time analytics, windowing has some extra fun stuff happening. A windowing function isn’t just a windowing function but it has something extra to go with it.
For this blog, I’m using the event stream created in an earlier blog. If you want to add a step, you can do that like this:
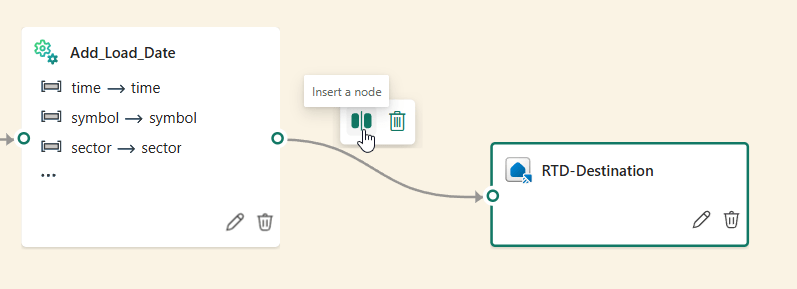
Click on it and this comes up.
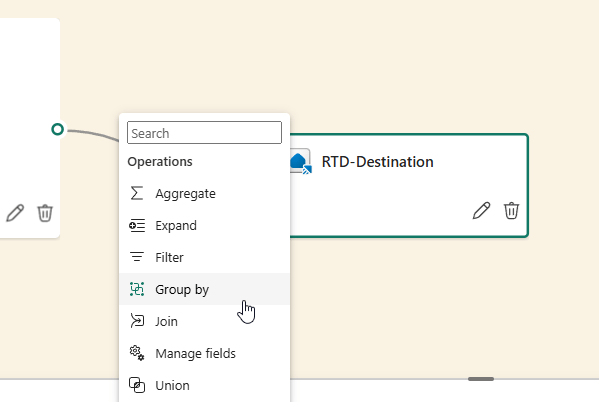
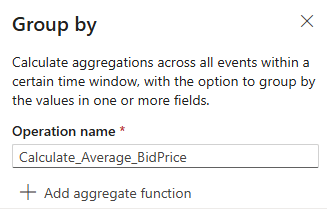
In this case we’re going for the group by option.
Of course it needs some set-up, and in the new pane on the right, you’ll see the following.
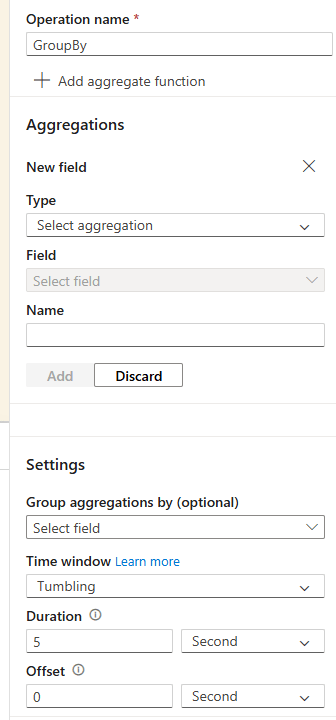
Settings
Before digging into the different aggregations, there’s a more interesting part; the settings. I’m not talking about the group by but the time window. This one has 5 options.
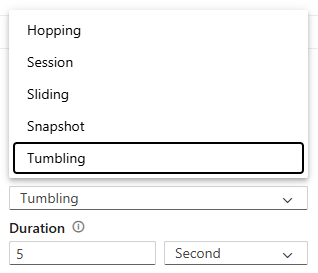
Understanding these different time windows is essential for understanding how real time analytics work with windowing functions. The video from Valerie will offer an explanation as well and features the same images, made by Valerie. You can read more about these specific functions when you click here. In this blog, I’ll just cover the basics, whereas the basic of these windows lies in the way you do aggregations on time series data. This is, you want to do some kind of aggregation based on a specific time definition. Real time offers these five different options.
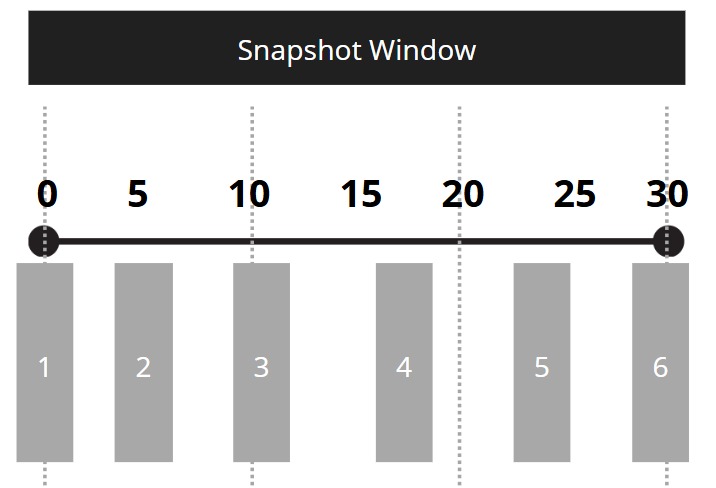
Snapshot window
A snapshot window is a single point in time. In other words, you’re looking for data created at a specific moment in time.
Hopping window
A hopping window has overlap between time periods. Contrary to the snapshot that has just one point in time, a hopping window has a period of time. In the graph shown below, you can see that window 1 has a timeframe of 10 seconds. All the data created within those 10 seconds is allowed for the aggregation. The next window overlaps the previous window by 5 seconds and then runs for 10 seconds. You can also refer to it as singing in canon; every x lines in the music, a new singer enters the choir.

Tumbling window
The tumbling window is unlike the hopping window when it comes to overlap, it doesn’t allow that. In this case the tumbling window is like an acrobat. When it has finished doing it’s somersault, it will start a new one. For all our sakes, I do hope it doesn’t get sick along the way.

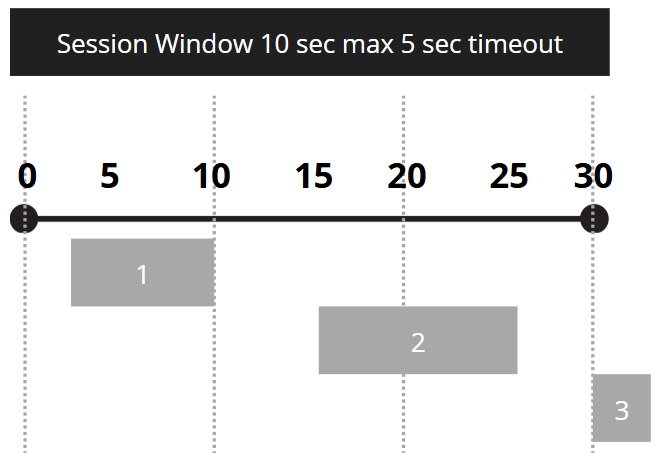
Session window
A session window is a bit of a weird one. It checks for incoming data and filters out the periods where there’s no data coming in. That’s why you see the gaps between blocks 1 and 2, no data came in during that period. The timeout will determine how long it will pause before opening the gates again for new data to come in. It is a really weird one.
Sliding window
Talking about weird windows, the sliding one is special as well. It groups events together that should belong together in windows of your designated length. Think of it as something that should happen a certain number of times within a specific time window. Or, less abstract, if you’re listening to a vinyl record and the needle jumps three times within a minute. This would qualify for a sliding window definition. And a reason to buy the CD.

Create a window
Now that you’ve got a basic understanding of the windows, let’s create one.
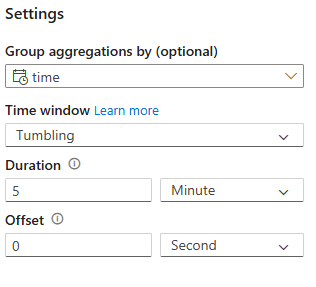
In this example, I’m going for the tumbling window. Just to show you how it works.
Settings
In the settings block, I’m selecting the Time window as Tumbling with a duration of 5 minutes.
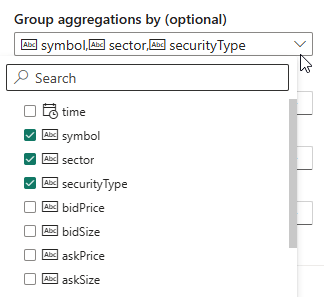
The group by aggregations can be set by clicking the checkboxes, shown as an example.
Aggregations
The aggregations have a number of different options, but not every data type is supported for these. Make sure you set the data types correctly before doing group by. By default, you will see everything as a string and string do not work well in aggregations.
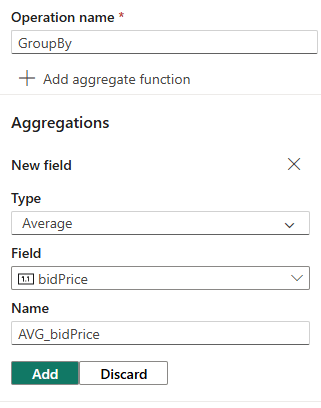
In this case, I’m creating an average of the bid price in the time window. The data will be stored in a new field, automatically named AVG_bidPrice. Click on Add to save your change.
Next, rename the operation to make sure it makes sense when you check it out later in the year.
When you click on Add aggregate function, you can, well, add another function. Remember that it will use the same setting for the window, you can’t create multiple time windows in one Group by operation.
Now hit save at the bottom of the screen and done.
Destination
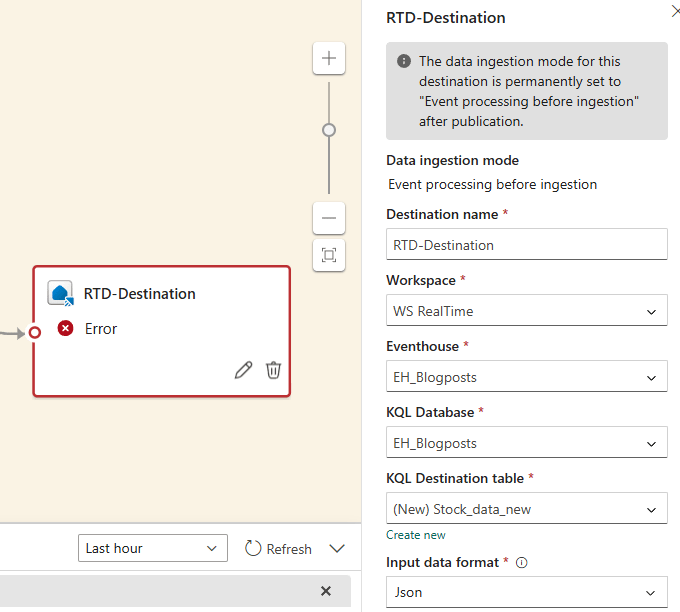
Well, almost. Because we changed the output by adding a column, the destination gets angry with us.

One solution is to keep the existing data in the existing table and load the new data into a new table.
This will technically fix the problem, the big question is, will it match with the end user? Will they accept a new table? How many processes and people are relying on the existing table? And many many more questions. So don’t take this approach as a default but check before you change.
Video
As always, Valerie created a video with her view and explanation of the window function as well.
Final thoughts
The concepts of windowing functions in the event stream are daunting. I’d advise you to play around with them using the demo data (like the bicycle data or Stock market data) and get used to how they work, what the output looks like and what it can do for preparing your data. Then make sure you have a valid use case for your end users that they can endorse. Create the stream in a testing environment and let the end users test, provide feedback and explain where things can be improved or should be changed. As you saw, changing the event stream can easily lead to a breaking change in the destination and that can set you up with a lot of work.

2 thoughts on “DP-700 training: create windowing functions”