This post can come as a shock if you’re used to writing T-SQL. Because not only is there more than one useful language to process data, realtime data in this case, but it also has enough similarities to SQL to look familiar and is different enough to leave you flustered.
Now, to get a complete introduction into KQL or the Kusto Query Language, one blogpost (or video) would never be enough. There are so many operators that can fill an entire series on their own.
In this blog, the focus will be on the basic structure of KQL and a number of common operators. They will be compared with the counterparts in SQL for reference.
Getting started
When you’re logged into Fabric, the correct workspace and your Eventhouse, you can start writing queries by clicking on the Query with code button.
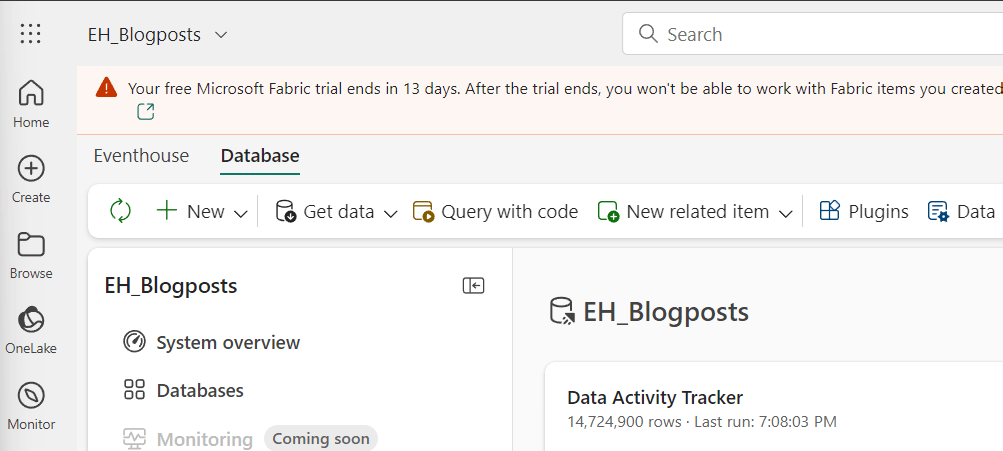
When you’ve clicked the button, a screen appears with some guidance links and three example queries.

Basic structure
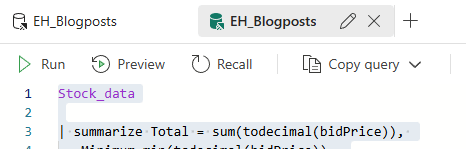
The basic structure of a KQL script is as follows.
On the first line you declare the table you want to select data from. This in itself is a valid KQL statement and will return (depending on the settings in your query editor) all the data or a subset of data limited by a time frame. When you start typing, you can see the table name appear:
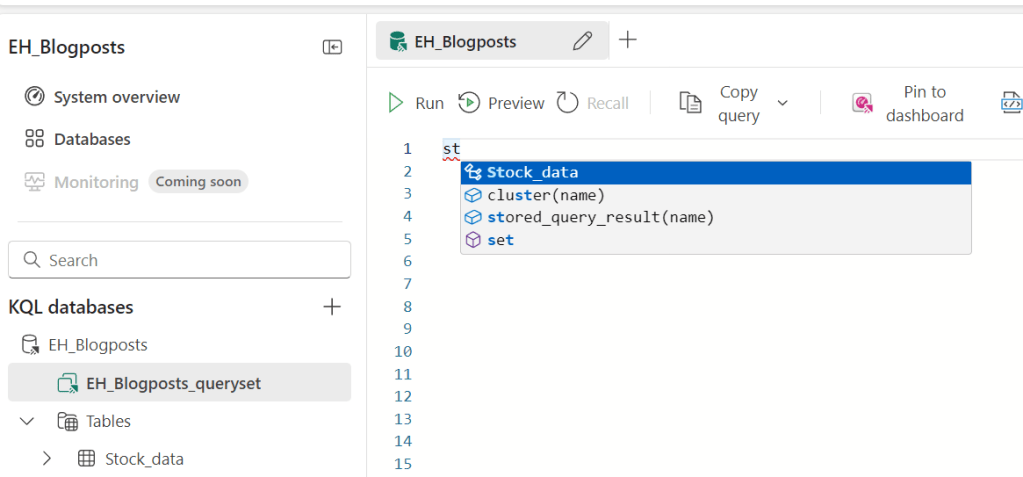
I started typing st and, as you can see in the bottom left corner, my table is called Stock_data. And this one appears in the window as well. You can either click it or keep typing, just what you want.
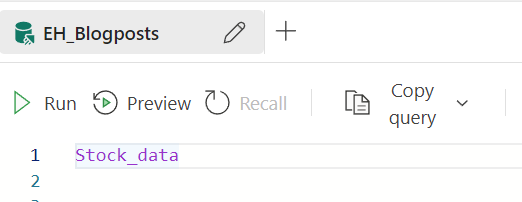
This code will return a result, though with an error/warning.
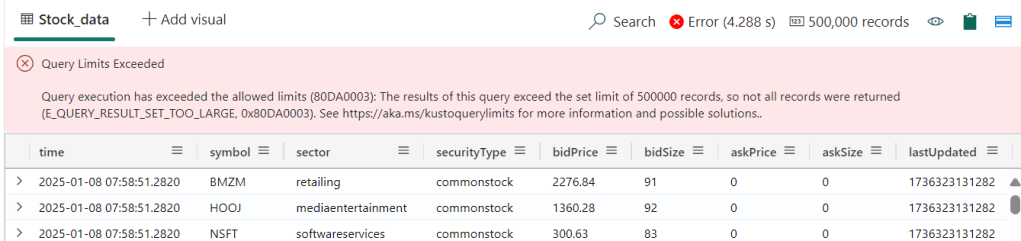
The limits can be found following this link, at the time of writing the limit sits at 500.000 records. Fair enough, I can’t see a quick use case for a human reading all those records.
One funny thing I found whilst writing this blogpost is that the editor doesn’t like empty lines.
The syntax highlighter loses track and everything falls back to standard mode. The code will execute though, as long as it’s syntactically correct.
The T-SQL counterpart
If you’d want to get the same result in T-SQL, you’d have to create the following script.
SELECT *
FROM dbo.Stock_data
Done?
So, now you know how to get data out of a KQL database. Good luck and see you.
No, a silly joke. Because this is only the beginning. Not only because there’s a limit to what the editor can handle, but also what you can handle. So let’s limit the output.
Take 5
No, not the Dave Brubeck song but just 5 records from the table.
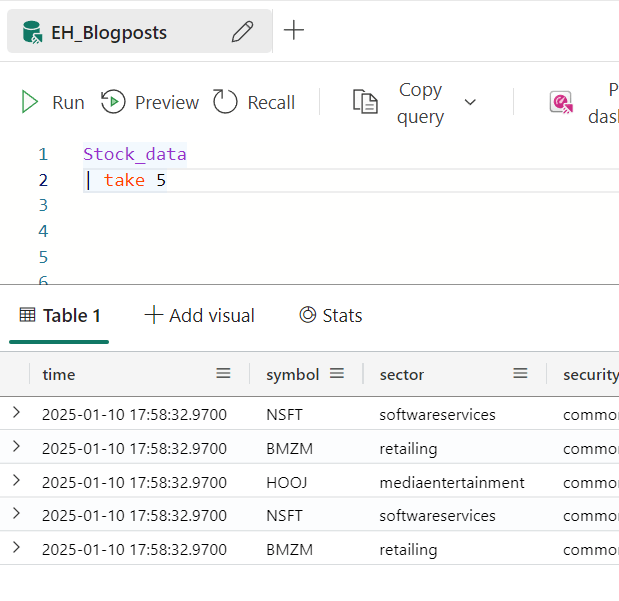
Now you can see something special happening. The next row is started by the pipe sign. This is part of the syntax, telling the interpreter there’s a new operator in play. So you start with a table, then the first operator, in this case the take operator, has the pipe sign in front of it. Every next line will have the pipe sign if there’s a new operator. It’s something to get used to at first.
The T-SQL counterpart
To get only 5 records from a table, you’d need the following query.
SELECT TOP 5 *
FROM dbo.Stock_data
Ordering the data
Now, if you’re coming from the SQL world like me, you should know that the order of the output is never guaranteed. Every query can return results in a different order. The same holds true for KQL, run this script a few times and you will notice differences in the result set.
To combat this behaviour, let’s add an order to the result set.
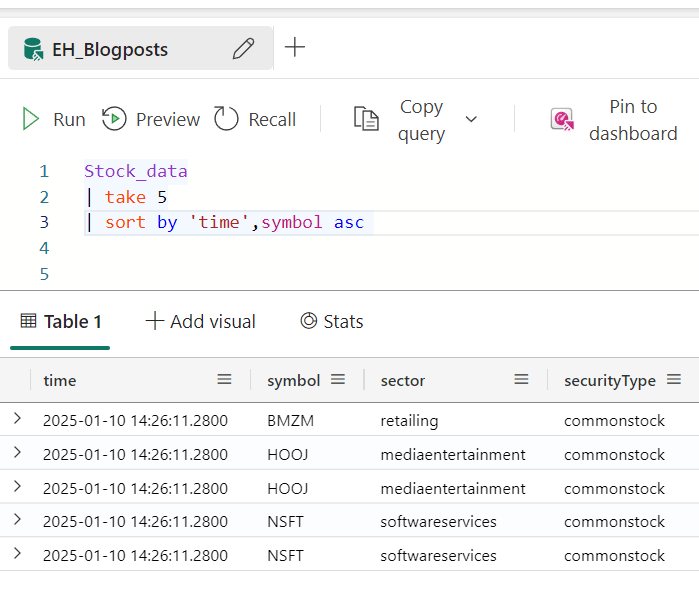
In this case, I’ve chosen to sort the output by time and symbol as these create a unique key over my data set. You can see that time on its own has duplicates. The reason time is between single quotes has to do with the fact that time is a function as well. You’d do the same in SQL by placing the column name between single quotes or square brackets.
The T-SQL counterpart
In T-SQL you’d have written something like this.
SELECT TOP 5 *
FROM dbo.Stock_data
ORDER BY [time], symbol ASC
So far, not much difference.
Limiting the columns
Until now, you’ve seen all the columns, but suppose we’d like to see only a subset of columns. In this case, you can project only the columns you need.
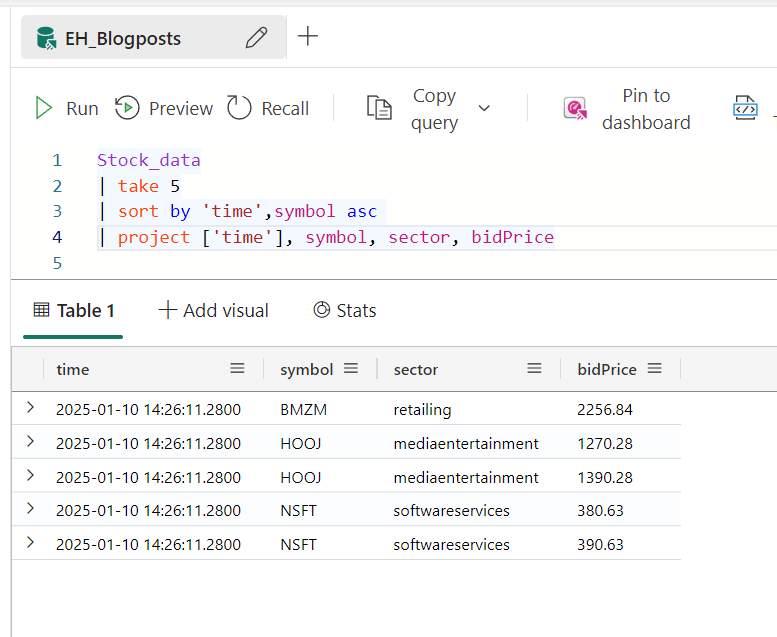
Now the query has an extra line with project. You can see that time not only has single quotes around it but also square brackets. This is necessary to show the content of the field instead of the name of the field. Furthermore, all the other columns are gone.
The T-SQL counterpart
If you were to write this query in T-SQL, it would look like this:
SELECT TOP 5 [time],
             symbol,
             sector,
             bidPrice
FROM dbo.Stock_data
ORDER BY [time], symbol ASC
Still not much of a difference which makes it both easier and harder to keep working with the differences.
Aggregations
Now time to make life a little more interesting; working with aggregations. Because single rows of data can be interesting but usually in BI, we’re looking for patterns, summations, min and max values etc.
So let’s go wild in this one and do a lot of these at the same time. Just because we can.
The different aggregations
There are a lot of aggregations to choose from, but the most common ones are the lowest,. highest, average, standard deviation and summation. Whenever you want to do any type of aggregation, just like in T-SQL, you need to declare the the group by which you want to do that summation. Also, it’s prettier to rename the column that will help the end user (or yourself) identify the process that created the value in that column.
All this together makes this last part a hefty one with a lot of things happening. We’ll get there, don’t worry.
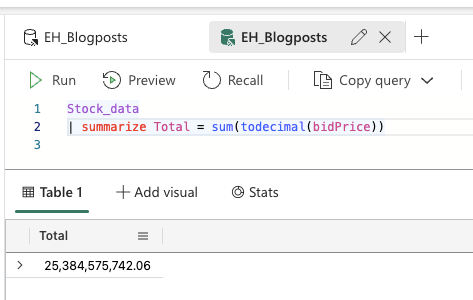
Sum
Let’s start by creating a total sum of the table. To do that, I need the keyword Summarize. Next I follow with an alias to give the column a name and the the sum() operator to create the total. In my query, you’ll also see the todecimal() operator. The only reason it’s there is that I forgot to change the incoming data type from the event stream. It’s coming in as a string and the data is saved as string, not as a decimal as it should.
Min and Max
Let’s add the lowest and highest values as well. Again these are simple operators; min() and max() where you need to place the column inside the brackets.
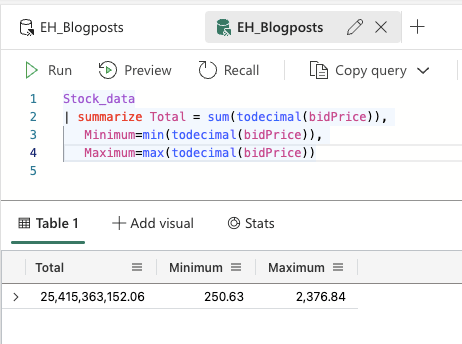
Not only did I add the min and max values of the data, for readability I put each operator on a new line, without the pipe sign indicating it’s a new operator. So the KQL interpreter still sees this as one step to take (and probably ditches the new line stuff) but for us it’s still possible to read the code as multiline instead of a single line that you need to keep scrolling through.
Average and standard deviation
The average and standard deviation are, again, built in functions. So the following screenshot won’t be much of a surprise.
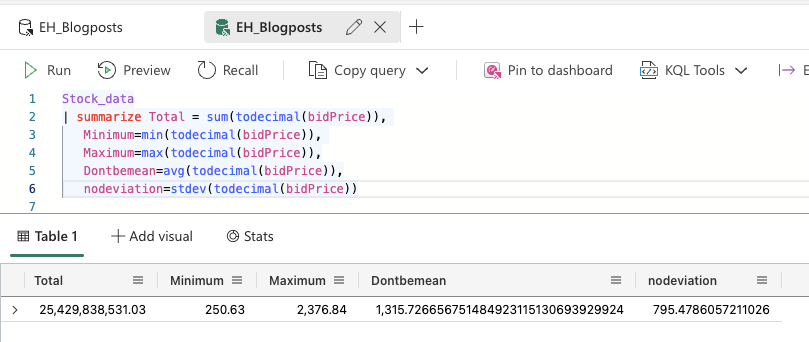
In six lines, I’ve got the basic view of the data with total, min, max, average and standard deviation. Not too bad. But I would like to see this data split for each stock that’s on offer.
By
No calm down, I’m not leaving you. It’s just that the by operator is going to tell the KQL interpreter what to do.
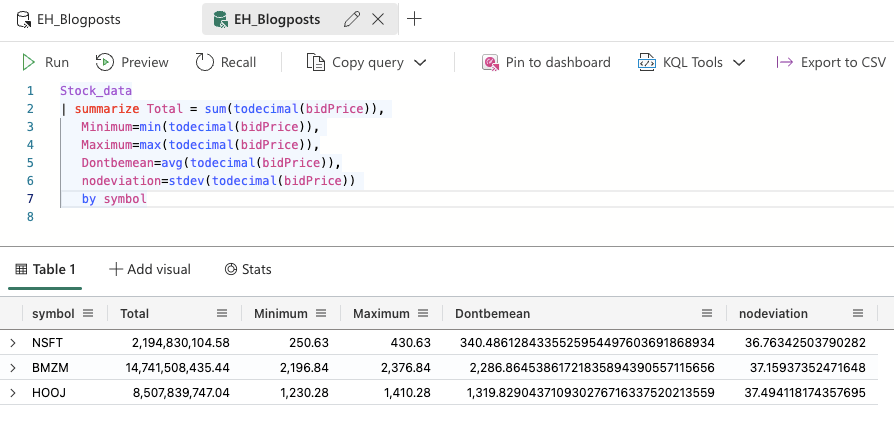
Now my data is neatly split over a number of different rows; by symbol.
Because this is only three rows it’s easy to read through them. In your line of work, you’ll probably have more rows and would like your data ordered. Or maybe it’s just me that likes some sort of organisation of the data.
sort
When I start to write my sort expression, the code helper jumps in and shows me the available columns.
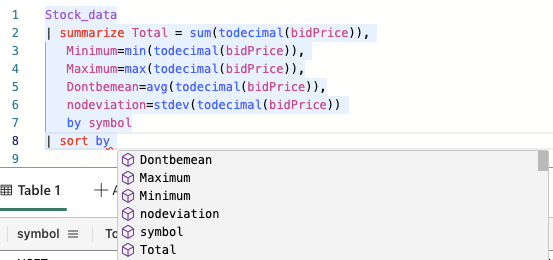
The main learning here is that you can’t use columns that haven’t been made available earlier in your query.
In this case, I’m going to use the new alias created to order my data.
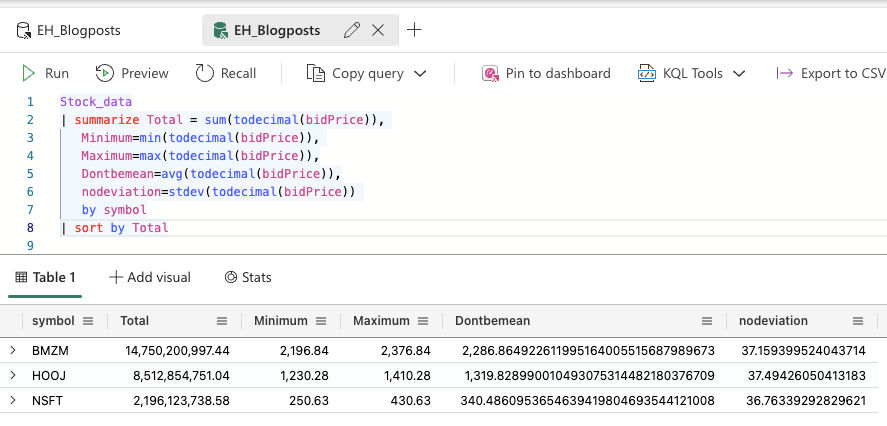
I was a little surprised to see the largest number on the first line as I’m used to T-SQL where ordering is always done ascending when no order hint is given. Like I try and teach in my SQL Basics training, always specify your sort order, never assume that it will be one way or the other.
The T-SQL counterpart
If I’d want to achieve the same result, this is what I would have to write in T-SQL.
SELECT symbol,
       SUM(CAST(bidPrice as decimal(36,2)) AS Total,
       MIN(CAST(bidPrice as decimal(6,4)) AS Minimum,
       MAX(CAST(bidPrice as decimal(6,4)) AS Maximum,
       AVG(CAST(bidPrice as decimal(36,4)) AS Dontbemean,
       STDEV(CAST(bidPrice as decimal(24,2)) AS nodeviation
FROM dbo.Stock_price
GROUP BY symbol
ORDER BY Total DESC
There’s a little more work to be done here, like telling SQL the decimal size. No huge differences but again enough to make you go hmmm…
Filter, please
After doing some fun stuff with the data, you will probably find that just getting a top amount of rows doesn’t work for you, a different sort of filtering is necessary. So let’s write a filter.
Now things start to get tricky because there are a lot of ways to create your where clause in the query.
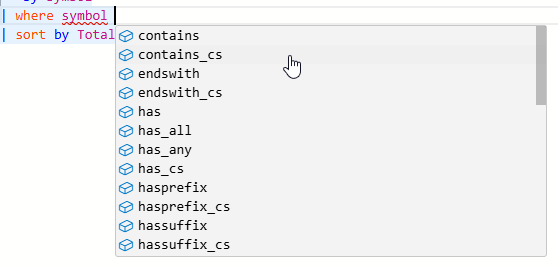
Please take a good look at the documentation to find the correct part of the syntax before you jump in (like I always do) and select the wrong option. You can click here to download a KQL cheat sheet.
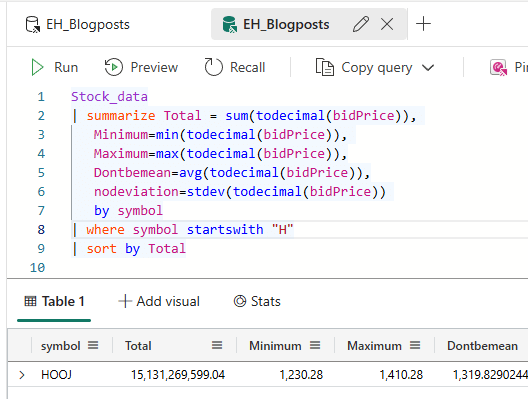
As an example, I’ve queried for the symbols starting with the letter H.
I strongly advise you to start exploring all the different options you can use to filter data.
Combining filters
Yes, you can combine filters with OR or AND clauses.
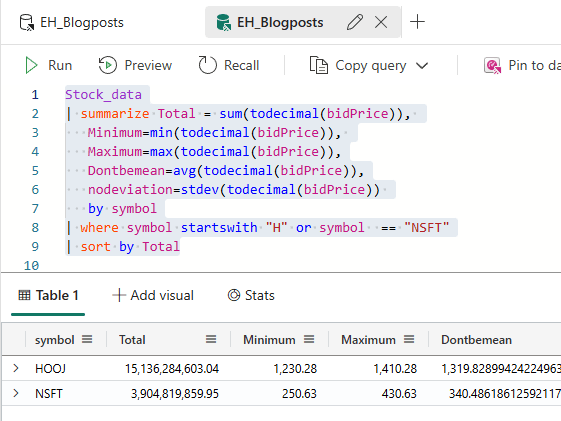
This opens both a plethora of options and pandoras box of results. One of the most prevalent issues in my work is customers signalling they miss data. And 99 out of 100 times it has something to do with where clauses acting in a different way than expected. Especially combining AND and OR clauses in a where statement are fun to debug and prone to unexpected results.
The T-SQL counterpart
In SQL, the syntax is a litte different. These are the tricky differences you need to keep in the back of your mind when writing the code.
SELECT symbol,
       SUM(CAST(bidPrice as decimal(36,2)) AS Total,
       MIN(CAST(bidPrice as decimal(6,4)) AS Minimum,
       MAX(CAST(bidPrice as decimal(6,4)) AS Maximum,
       AVG(CAST(bidPrice as decimal(36,4)) AS Dontbemean,
       STDEV(CAST(bidPrice as decimal(24,2)) AS nodeviation
FROM dbo.Stock_price
WHERE symbol LIKE 'H%'
OR symbol = 'NSFT'
GROUP BY symbol
ORDER BY Total DESC
Is this it then?
Well, for this blogpost it is. I’m happy you’ve made it this far. There’s a lot more to the KQL syntax than just these relatively simple operators. But the syntax structure remains the same. Each operator starts with a pipe sign, project only the columns you need and you can use new lines to keep everything readable.
If you want to learn more, follow this link to the KQL documentation for all the operators.
Video time!
Now, as usual in this series, Valerie has created a video where she shares her take on the KQL syntax. Click below to watch the video!

3 thoughts on “DP-700 Training: Process data using KQL”