Some time ago, a client came up with a very intriguing question. As I love a challenge, especially when you get to dig deep into a toolset, I jumped at the occasion and went for it. The following is a write up about the steps taken to analyse. Both for future me when I run into something similar (Hi future me, nice to see you and your failing memory again ;)) and for your entertainment. Or learn something. Or both.
The issue
The issue was quite straightforward. The client has a mapping data flow in Synapse that processes a few hundred to a few thousand rows but takes 15 minutes to complete. The low number of rows compared to the time necessary is a cause for concern.
The data extraction needs a staging storage account where the data is written into TXT files. The second step of the mapping data flow reads the TXT files and writes them out in delta format, which is Parquet files.
The source is an S4Hana CDC table, the target of which is a regular Azure storage account.
Dissecting the time
One thing I noticed when digging deeper is that the flow seemed to do nothing, and it did that quite often. It was waiting for 3-4 minutes to get the cluster online. Then, the ingestion part, including staging, looked like it took about 40 seconds, followed by a long time of waiting again. Then, it was a wide array of times before the final step finished.
According to the log, writing out the data took just a few seconds. This means a lot of time is being lost waiting for something. The question is, what is it waiting for? Or is the runtime busy processing the data?
Storage logs
To find out if the storage was an issue, I enabled logs on the storage accounts—both the staging account and the account where the delta parquet files are stored. The logs showed little time was lost between writing the data into the staging account and reading it for further processing, around 10-11 seconds between both steps.
So again, why the long wait?
Wide table
The source table has around 520 columns. I assumed that all those columns would put a huge load on the cluster, maybe claiming a lot of memory and therefore slowing the process down. To test this assumption, I added a select block into the stream. There, I hit a little snag; you’re not allowed to automagically add all the columns and then remove them.
The trick is to edit the underlying JSON by clicking on the {} icon.
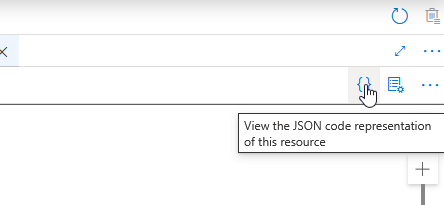
This reveals not only all the columns but also some data types. There, I found that a few columns are binary. This felt like an odd column type for a data warehouse, so I dropped these and 100 random columns. I added the rest to the JSON, ensuring the structure was still sound.
The new process was 45% faster when running on the first run. However, the second run was just as slow as the original process. Dropping another 100 columns had a little effect, but not what I was hoping for.
Whilst the theory still stands that you have to limit the number of columns you process, this wasn’t the option to get me over the finish line.
Integration Runtime
This is where I started to get suspicious of the runtime. Every time the process was quicker, there was no start-up time of the cluster. The data flow would connect to an available cluster.
So maybe, the data flow was structurally out of luck with the runtime.
So, I created a new runtime and decided to create it in my local region, where all the other resources are located. Only to find out that this source system doesn’t allow that. I dropped that one and created a new one with a number of specific settings. The one that seemed to get me over the finish line was the Copy compute scale setting. By setting a size and a Time to Live (TTL), the cluster remained available for other work.

If you want to read more on the intricacies of this setting, please follow this link.
The first run was significantly quicker but still had the cluster warm-up time. The second run took between 3 and 4 minutes. Digging into the run times revealed that little time was wasted on queuing; apparently, the cluster was available for every step. I then created a trigger to run the process every 15 minutes, just on the edge of the integration runtime’s time to live.
And every run fell into the 3-4 minutes window.
Finally
This blog is a summary of a lot of testing. I have excluded the things I tried that didn’t work. These were steps like changing the compression, sink permissions, and sink data type. In the end, the configuration of the Integration Runtime was the key to the solution in this specific case.
If you encounter similar issues and find a different solution, feel free to share it in the comments below.
Thanks for reading!

One thought on “Azure Synapse Analytics performance, an analysis”