When we create a data solution for our company or clients, we create the best, right? Sure, we do. But still, monitoring the solution is something you should never forget. Your solution can be stable, but the data usually isn’t. And it just feels good to know all the data has been processed correctly.
So, let’s dig into monitoring Microsoft Fabric.
What’s on offer?
Before diving into the real stuff, let’s take a good look at what Fabric offers in terms of Monitoring. And no, this blog will not cover the Fabric Capacity Metrics App. Yes, it provides many options on monitoring Fabric, but it’s aimed more at the capacity level; you won’t find anything related to how your items have run within Fabric.
When you look at the documentation, Microsoft advises you to monitor all the items that deliver data. According to them, you need to monitor the following:
- Pipelines
- Dataflows
- Semantic Model refreshes
- Spark jobs, notebooks, and lakehouses
- Event streams
In other words, your ingestion, processing, and serving of the data. I’m missing the Warehouse, Eventhouse, and the Fabric SQL Database. Even though they are not mentioned in the official Learn documentation, I think knowing how to monitor these items adds value to your knowledge.
Fabric Monitor Hub
As many of you probably know, I hate general marketing terms. One of these is the “single pane of glass.” Because my computer monitor and the web page I’m opening aren’t made of glass, I’d rather say the Fabric Monitor Hub is the central pane within Fabric where you can review all your items that have run.
Where can I find it?

In the portal (at the time of writing, because our friends from Redmond tend to change the layout of portals often), it is the third option from the top, also clearly labeled Monitor.
The Monitor hub
When you click on the icon, the hub opens within a second and reveals the state of your environment. It should look different from my screenshot!

In this first screenshot, you can see that some processes, like notebooks and pipelines, succeeded, and some didn’t. The first thing I’m missing is the runtime of the item. If you agree, please vote for this item. And yes, I know you can add the column, but it’s added to the right, and I would like to see it next to the activity name. I can do this by clicking on the six dots next to the name of the option.
Adding columns
You can add a large number of columns if you want to get more information in this pane.
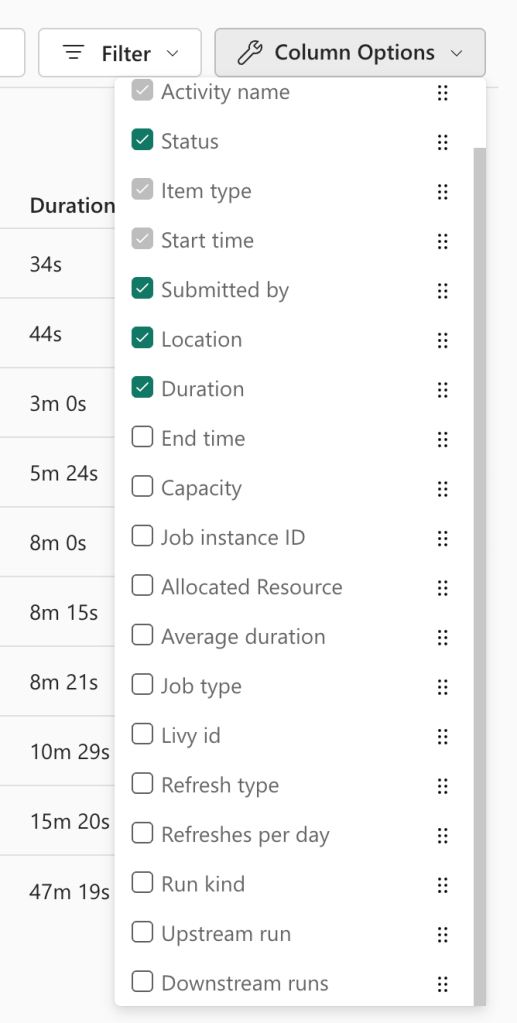
This method allows you to add a lot of information, which can be good. However, it can also be overwhelming, so just take your time to evaluate the different options. For instance, the Livy ID is usually only necessary when you ask for help from Microsoft Support.
Digging deeper
So, apart from a large start view, what else does the Monitor hub offer? That’s a good question; let’s see what we can find!

When you hover over an item, successful or failed, you will see two things appear. The first is circled i, and the other is the three dots. Both allow you access to more details.
The circled i is nothing less that a shortcut for what the three dots will offer:

The small menu appearing from the three dots will present you with the option to open the item, view its details, or view historical runs.
Open
When you click Open, the following happens.
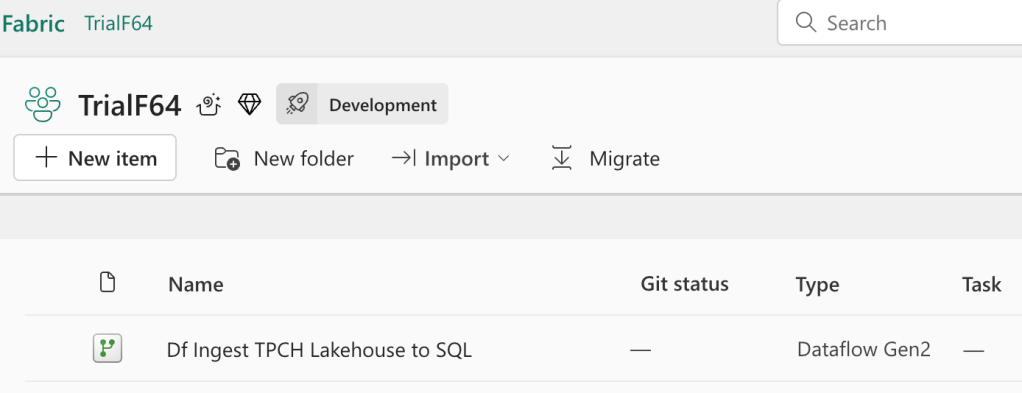
You will be redirected to the workspace where the item resides. There, you can open it to view its contents. To be honest, this is not exactly what I was expecting. When I click open on an item, I’d expect to open the item itself, not its context.
View detail
So, opening the item redirects you. What do the details reveal?

Cool. It shows me details of the run I’ve selected. Again, I’m a little disappointed, as this would have been an excellent place to show the error message as well. Because this particular flow failed, the details would have been the best place to show the error, with more information about it. Instead, it’s showing some details of this dataflow. Again, the link doesn’t open the dataflow itself but the workspace it’s in.
Historical runs
The final option you get is the one with the historical runs.

This will give a very nice overview of the available runs from Fabric, making it easier to detect deviations. Just like in the main overview, you get the same options with information and details. You shouldn’t be surprised that the historical runs option is missing here, as you’re already there.
Error details
One of the things I’m always interested in is the details of an error. Why was Fabric angry with me this time? No matter where you click in the monitor pane, you won’t find a link to the error. It just shows that there was an error. End of story.
You can find the most recent error in your workspace by clicking the warning icon.

When you click on this, a new window will open showing you a lot of details.

You can see the different parts of this data flow, including the failed parts. If you scroll down, you’ll find the errors, warnings, etc.
Also note that there’s an arrow at the top left of this window. When you click that one, this appears.

This view offers you some more historical information about the selected item, including error information. You can either click on the link to see the details of that specific run or download the data as CSV to save and analyse later.
The CSV data looks like this.

The file contains the information shown on screen, with details and error messages.
Monitoring real time
One thing you should consider when building a real-time solution is how to check for anomalies. Suppose you’re monitoring the temperature of a device, and all of a sudden, there’s a change. The device is overheating, for instance. As you’ve seen, the Fabric Monitor won’t help you there, as the ingestion of the real-time data just works. This is purely data-related, so you need something that keeps checking your data and reports anomalies.
Data Activator
Data Activator comes in, the item that can help you detect the anomaly and send you an email, a Teams message, or leverage Power Automate.
You can create an activator in your real-time solution and connect it to your existing event stream.
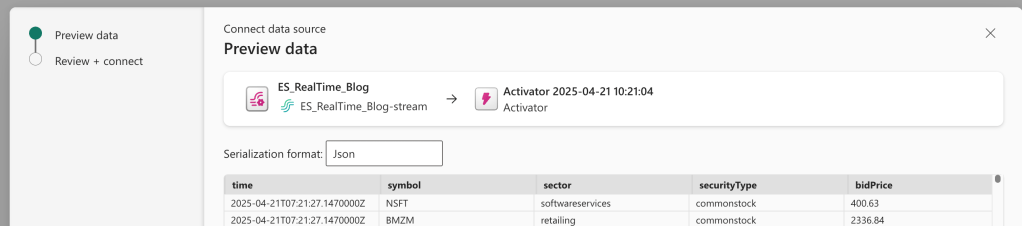
When you click next, it just confirms that Activator is connected to this event stream.
It then showed me this nice pop-up.
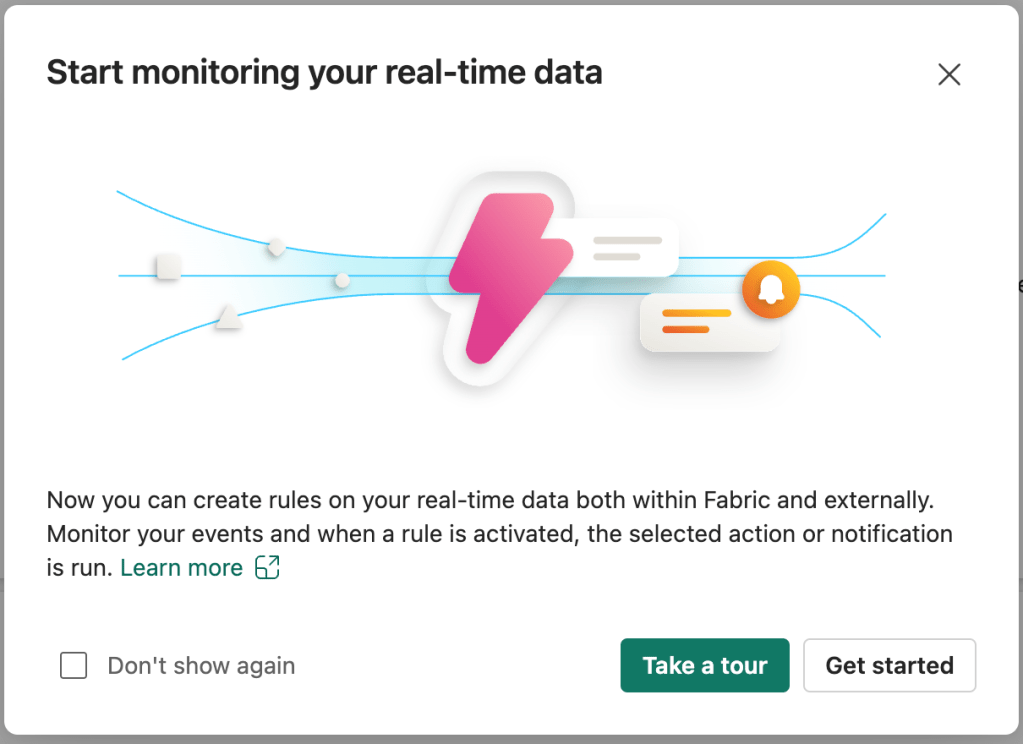
When you click on “get started,” a new window opens. You can create new actions, so let’s see what that offers.
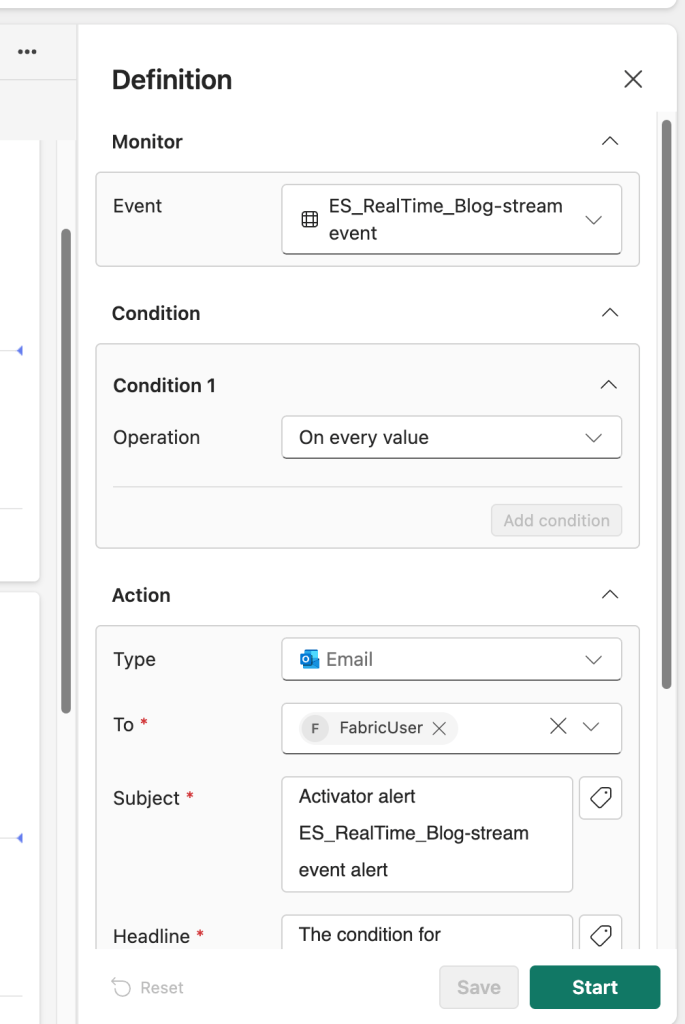
Now you can create the definition for your activator, for instance, the value X shouldn’t be lower than 10. That’s the condition you’re monitoring for
Next, you can define the action. By default, it’s set to send you an email, but there are more options available.
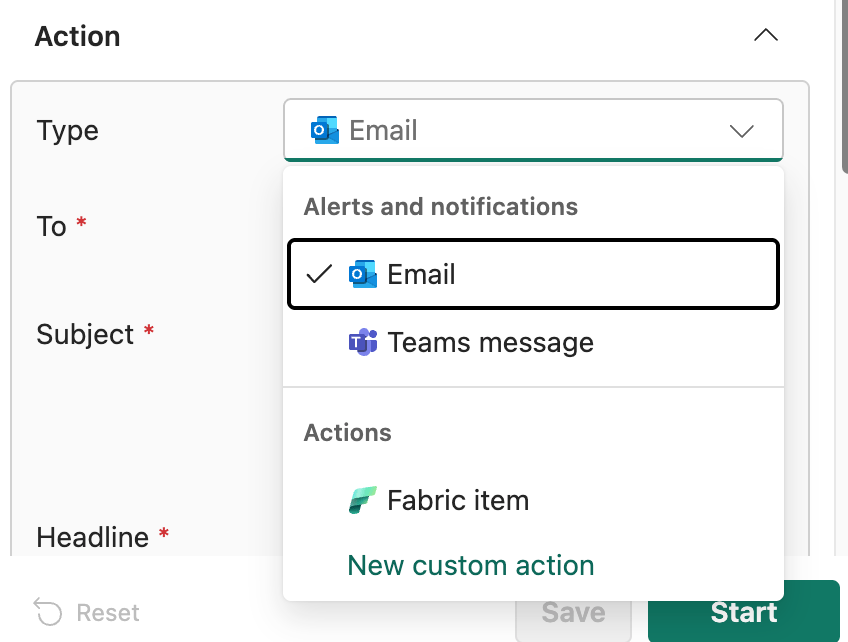
You can send a team message, start a Fabric item, or use a custom action. Let’s see what this last one is.

This option will allow me to create anything I want in Power Automate. It can open any resource in Azure or on-premises because Power Automate can do so many things. Remember that some licensing is involved, but if you invest time in this, you’ll find it well spent.
Video!
So you’ve made it to the end, well done! Now time to learn from Valerie who created an excellent video on this subject!

2 thoughts on “DP-700 Training: Monitor hub”