Let me set the scene quickly for you. You’re working for an organisation where Fabric is in the process of being adopted or it’s already fully in use. Regardless of the number of capacities, workspaces, etc, you’re interested in what’s going on in your Fabric environment. You have questions like “Who is using the reports?”, “Who is changing settings in the Admin panel?” and “How is my capacity being used?”.
If you want the answers to these questions, there are multiple, different approaches you can take. You can use Purview to obtain governance information. You could use the Fabric and Power BI APIs to dig into report usage, or you could use the Fabric Capacity Metrics App to see how one capacity is being used.
The thing is, these are all different tools that all serve their purpose, but none of these combine all the information. And it’s a lot of work to set it all up.
DBA Checks
This challenge isn’t new. When I started out in the field of database administration, one of the things I learned was how to check if SQL Server backups had run. This meant logging into the server, checking the Job agent history, marking it as successful (or restarting the job) and moving on to the next.
The great people behind DBA Tools created a toolset named DBA Checks, which allows you to automate this task and display a Power BI report with history, warnings, and more.
FUAM, short for Fabric Unified Admin Monitoring, does the same thing. It automates the entire process and provides an extensive report for your review. You can dig deeper into things that interest you. The biggest win is that you don’t have to think about all the different tools to get the information. It’s all done for you.
Sounds amazing, right? Want to know something even more amazing? It’s free.
Learning FUAM
A few weeks ago, I first heard about FUAM. I was surprised and wanted to learn more about it, but I just couldn’t find the time. I then realised that Data Saturday Rheinland, a wonderful conference, had it on the agenda as one of the first sessions of the day. As my own session that day was much later, I made sure to be on time and have a front-row seat.
The session began much like I started this blog post, which means I must thank Oliver Engels for the inspiration. While the session was going on, I felt myself getting impatient. Not because of the presenters, but I wanted to get my hands on this. I wanted to install it, play with it and learn how it works. More on that in a moment.
The session had a nice build-up, where they showed the GitHub repository with all the files, explained installation and configuration, and then proceeded to show the dashboards. If I remember correctly, it’s been somewhere between 6 months and a year in the making, and that shows.
The other thing is, even though it’s created by two people who work for Microsoft, it’s not a Microsoft product. Microsoft doesn’t support it; they help by hosting the code in the Fabric Tools GitHub organisation.
Installation
To write about my installation experience would be nothing more than regurgitating the steps described here. so I won’t do that, also because there’s a fair chance that by the time you’re reading this, things have changed.
The most interesting parts are these.
First, the installation went without error, retry or anything. It just worked. Simply follow the well-documented steps, and you’ll be done.
Second, the installation was fast. The initial notebook took about 13 minutes to run, and the end-to-end pipeline a little over an hour. This is with FUAM using an F4 capacity, and in the tenant I was using, there are 5 other capacities (not all active) and a few hundred different items.
The advice is to run the data-collecting pipeline at night to ensure you receive the latest and most up-to-date information first thing in the morning.
Core report
This is what it’s all about, one report to show you all the good stuff.
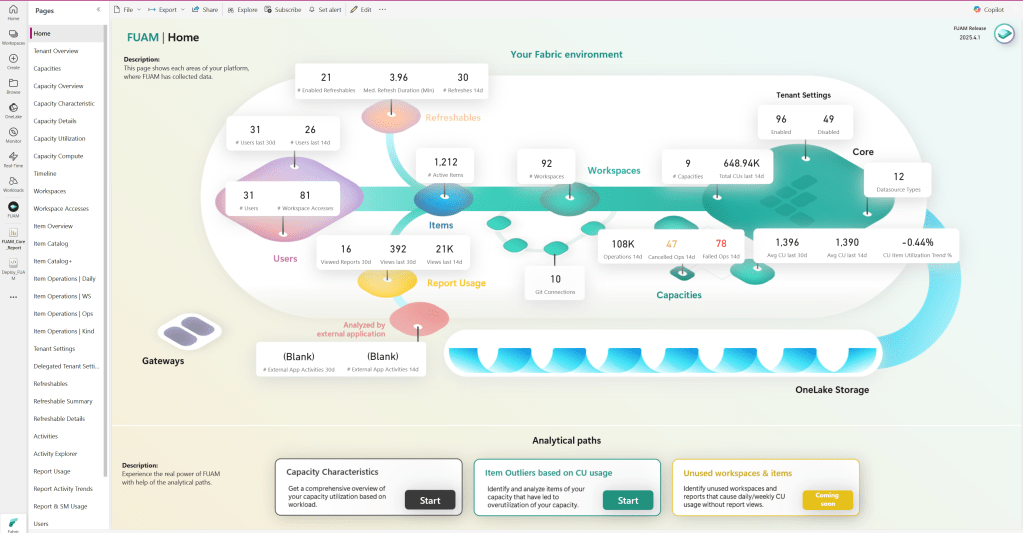
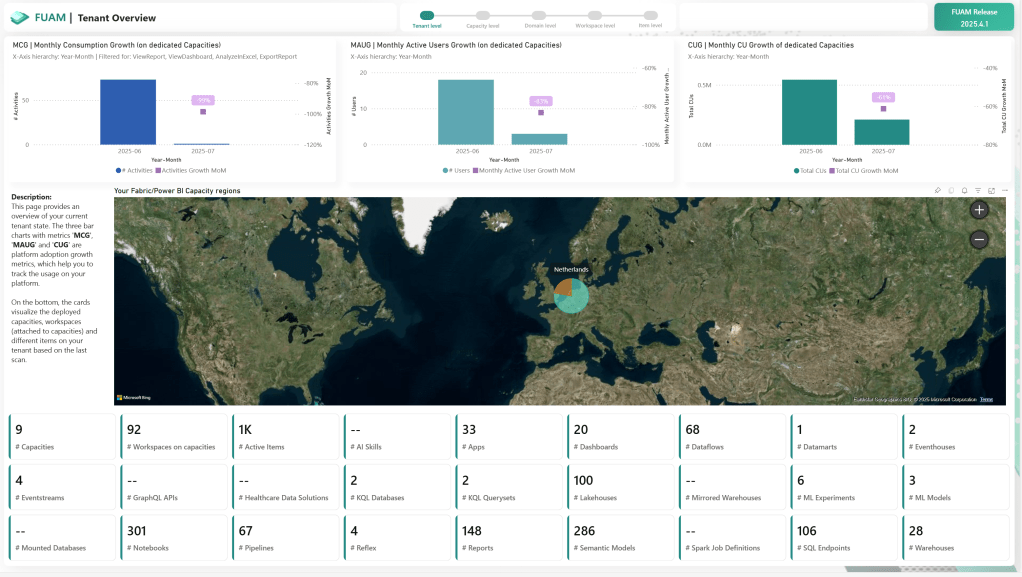
This report provides a general overview of your Fabric estate, with a huge list of options to choose from on the left.
Capacity usage
One of the things that’s always interesting is the number of capacities in use. And, how much they’re being used.
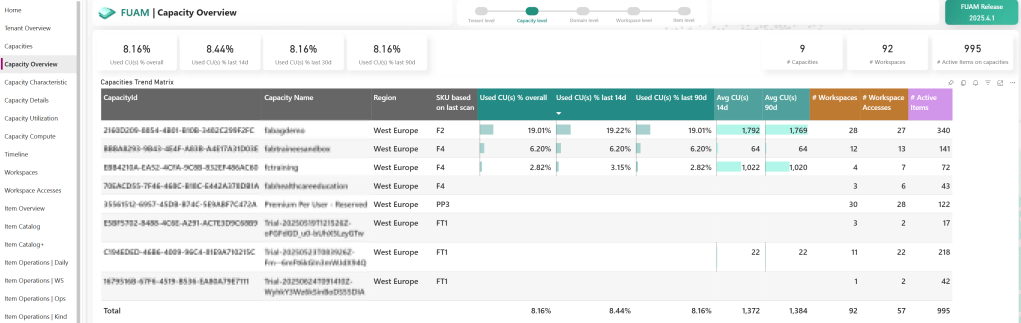
It might not be all that easy to read, but in short, this shows the capacity usage of the tenant. From overall usage to usage per capacity, average capacity units used, etc. This will give me a good indication of whether capacities can be scaled down, scaled up, or possibly removed. One dashboard to provide me with the first headlines, rather than having to work my way through the capacity metrics app for each capacity.
Another point of interest for many people is the location of the capacities. Especially when your data is geographically bound, it’s very nice to see where the capacities are deployed as these are tied to your data location.
This pane also shows you high level numbers on your tenant. As my FUAM environment is new, it doesn’t have much history, but in time trends will appear.
Tenant settings
Another very interesting part of Fabric is the tenant settings. Anyone with the Fabric Administrator role can change these settings, and you can’t detect who changed a setting from the portal. However, there are other ways to find out, because, again, FUAM will not only provide a comprehensive overview of all the settings and their history (making it easy to see when a specific setting changed) but also identify who is the culprit.
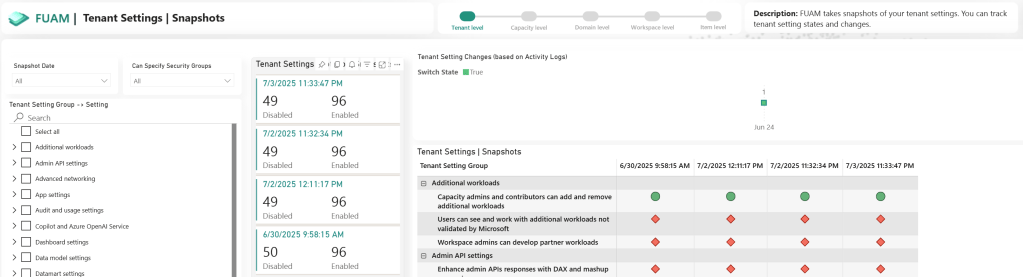
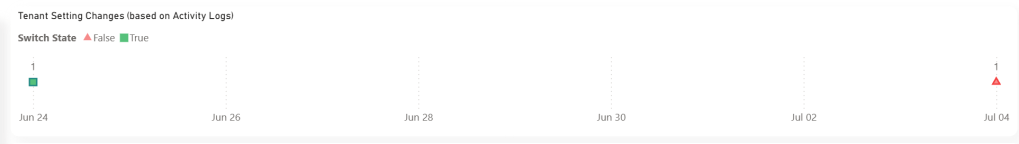
So, what can you see when a change is applied?

This cropped screenshot shows you that a setting has been changed from true to false. At the top of this table, you will find the data and time of the run, providing an indication of when this change occurred.
Additionally, you want to know who is responsible for this. By clicking on this icon at the top of the screen, you can view details.
And then, you get to see what you were looking for by hovering over the, in this case, triangle.
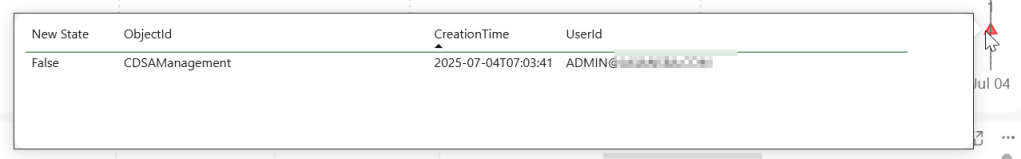
In this case, it was the Admin account that was changing settings. The CreationTime is the actual point in time when the change was made. So the table with all the settings is showing the point in time of the data collection run, the detail shows the actual time the change was made. In this case, I used the Admin account to demonstrate that even high-privilege accounts can be registered. For me, this is a massive help in administering the environment.
Best practices
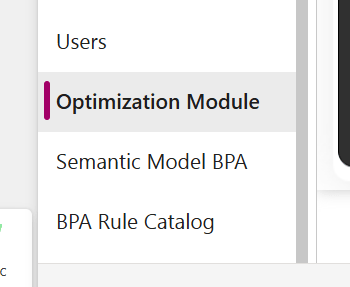
A little hidden, as you need to scroll down, are the best practices analysers for reports.
These are mostly aimed at reporting things, and, as you might know, I’m not particularly skilled at reporting. I know people who are, and they will know what to do with this information. Think about optimising DAX, for instance. Agai, this isn an amazing extra feature that will help you get the most out of your Fabric tenant!
Short video
There are a lot of other features available, some very cool ones you can find in this short video created by the makers of FUAM.
Missing features?
The only feature I’m missing, and for which I’ve filed a feature request, is a comprehensive overview of all users in the user pane. I’ve had numerous questions from people who were unable to access a workspace, edit content, or create certain items. Having an overview to quickly verify if it’s a user issue or a permissions issue would be amazing.
Maybe you’re missing something else; just let the good people of FUAM know. Also, please remember that this is a community product created by individuals who do this in their spare time.
Finally
What are you waiting for? Get cracking with this toolset and see what it can do for you. If you’re in the same situation I am, using this free, open-source tool can make your work a lot easier and more efficient.

One thought on “Streamline Fabric Monitoring and Administration Using FUAM”