Let’s dig into something that’s quite simple to implement: workspace monitoring.
Whenever someone calls out that “something is simple to implement”, your first response should be “Oh really?”. Because simplicity is always in the eyes of the beholder. And sometimes the easiest solutions carry the most consequences. Or cost. Or both.
Wording can be complicated, so when Microsoft is talking about logging, it can also mean monitoring. Read on to find out why.
What are you writing about?
Good question, let’s start at the beginning. When you’re running a proof of concept or having fun in a sandbox environment, you’re probably running on a trial capacity (which is free) or on a small dedicated one where it’s not a big deal if it stops working because you’ve overused the capacity.
Things change, however, when you start a real project. In that case, you probably want to know more about what’s happening in your workspace. In short, you need some telemetry for analysis.
So, the Fabric Capacity Metrics App?
Well, yes, this will give you an overview, but you’ll have to refresh the underlying semantic model, refresh the data and then find out it’s hard to determine which workspace it’s all about. And the app only shows you data about the capacity usage. This is very relevant information, but in this case, we’re looking for other data.
Two towers
Unlike Lord of the Rings, for each workspace, you have to make a choice. Either use a Log Analytics Workspace or an Eventhouse to store the data. With an Eventhouse, you’re keeping all the data inside Microsoft Fabric. Which can be a good thing. But remember that using an Eventhouse will cost you capacity units. From another project, I’ve seen that an Eventhouse can be very efficient when it comes to using compute and storage. Still, when you connect a lot of workspaces to it, things might add up.
With the Log Analytics Workspace, data will be stored outside of Fabric. In Azure, things are calculated differently. The main point here is that, if I were you, I’d make my choice based on your current setup. If all resources are storing their telemetry in Log Analytics, and there’s a lot connected to that, by all means, add Fabric to that to keep a single pane of glass for monitoring.
Log analytics workspace
If you decide to use a log analytics workspace, you can find this in the Workspace settings:
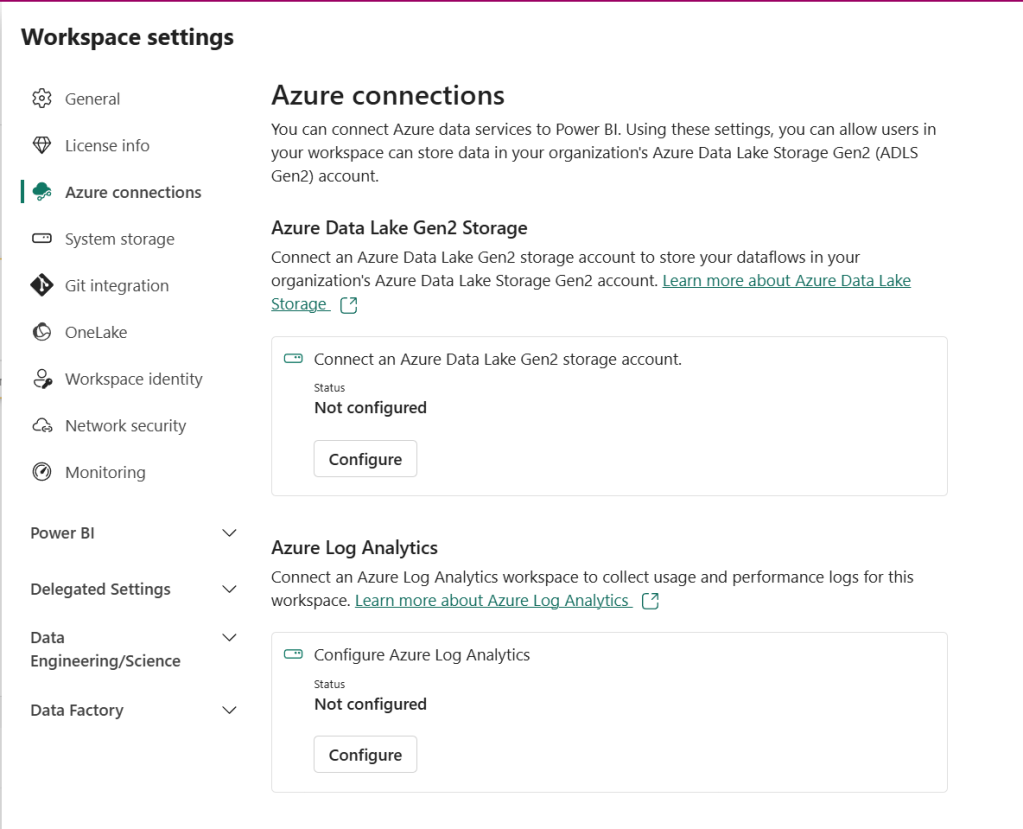
If you open the Azure connections, you can see the option to connect to an Azure Log Analytics workspace.
Click on configure to open the options.
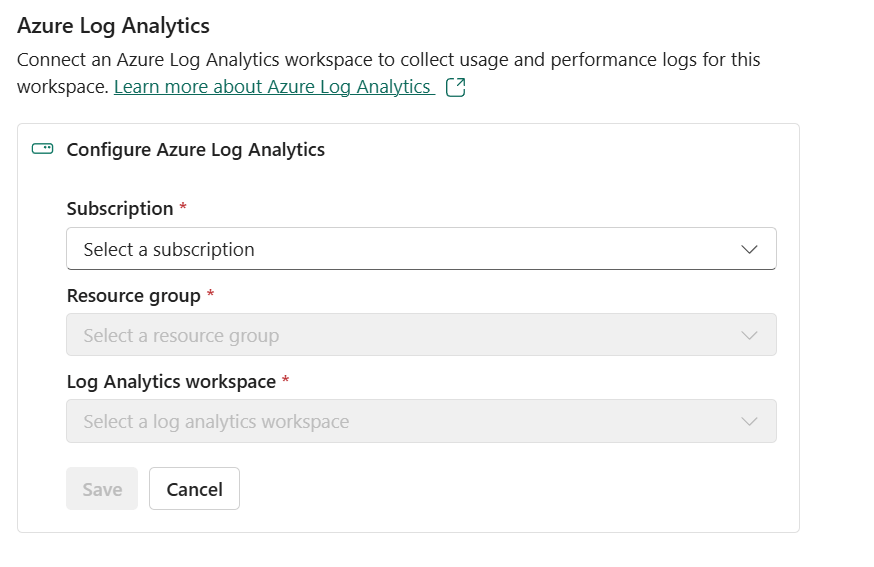
Fill in the information necessary.
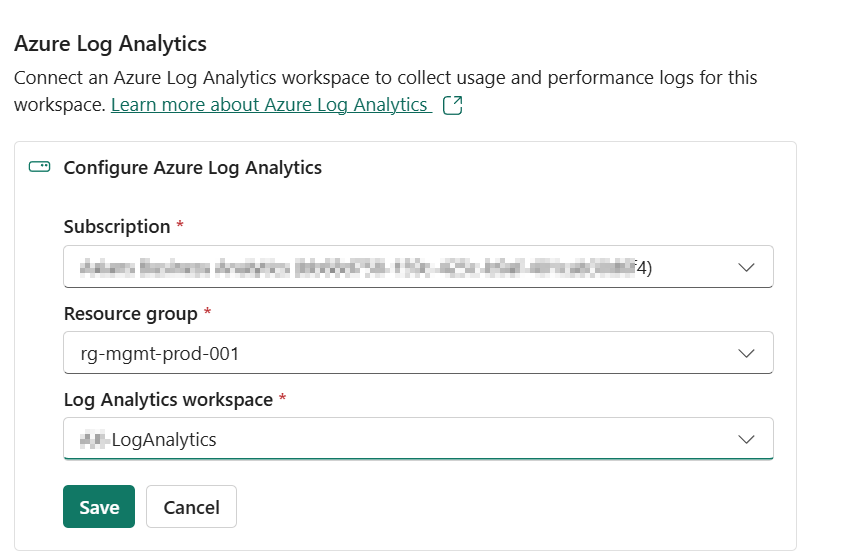
One thing you’ll notice is that you’ll get all the subscriptions in the dropdown. However, the resource group dropdown will only display those that contain a Log Analytics workspace. A little thing to make your life easier.
Click on save, and you’re done.
Ok, the log analytics workspace is connected, now what? You go to your Log Analytics workspace and you try to find the information you need. The issue is that finding the data is challenging, and the process is complicated. It only stores usage and performance logs. In other words, it’s not exactly what we’re looking for in this specific subject.
Eventhouse
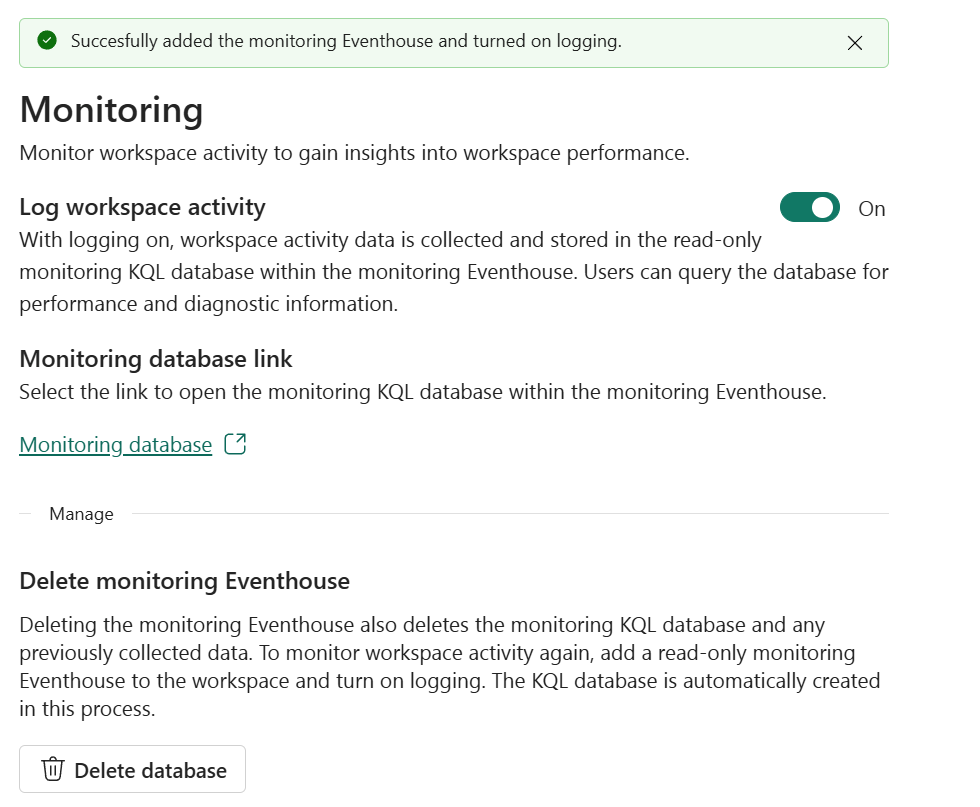
The thing we are looking for is this.
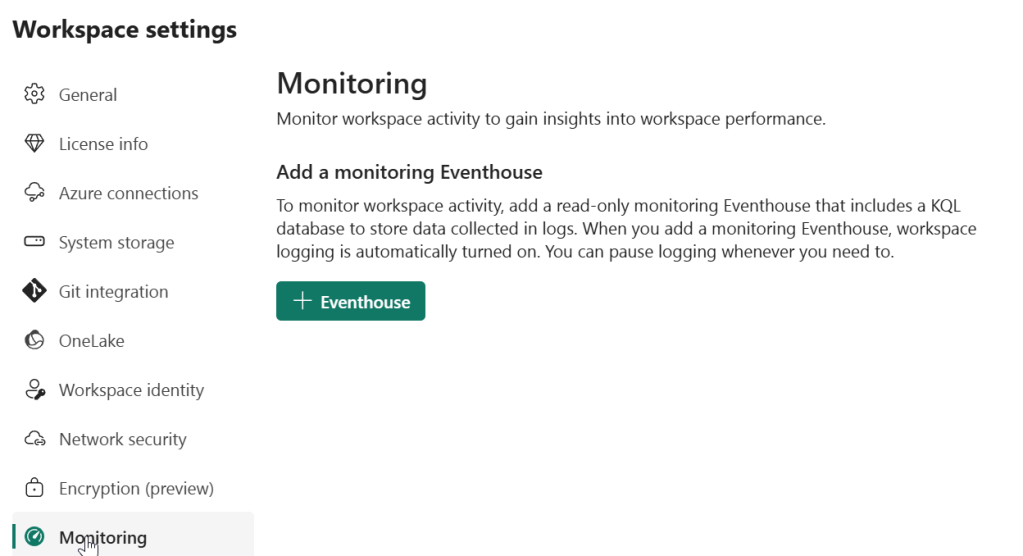
The confusing thing is that Microsoft is calling it logging, but it is monitoring. Synonyms, maybe, but it can really throw you off the scent when hunting down the correct option. To help you stay on the right path, I’ve described the other options above.
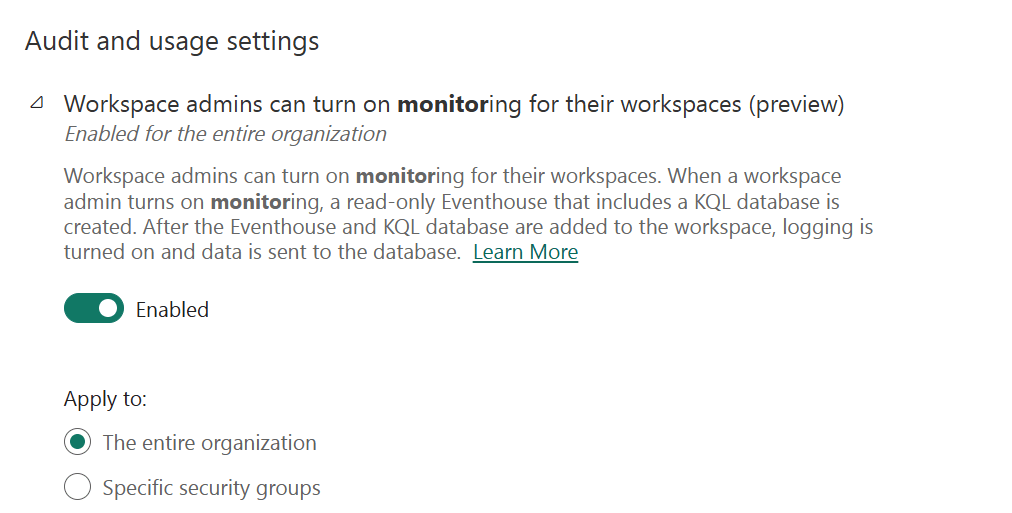
First, make sure the tenant admins allow you to create monitoring.
Also, make sure that the setting above, writing to a Log Analytics Workspace, is disabled. You can’t do both. Fabric will return an error that doesn’t tell you what is blocking you. So, if you run into an issue configuring the Eventhouse, make sure the export to the Log Analytics Workspace is disabled.
Adding the Eventhouse
Click on the plus sign to add an Eventhouse.
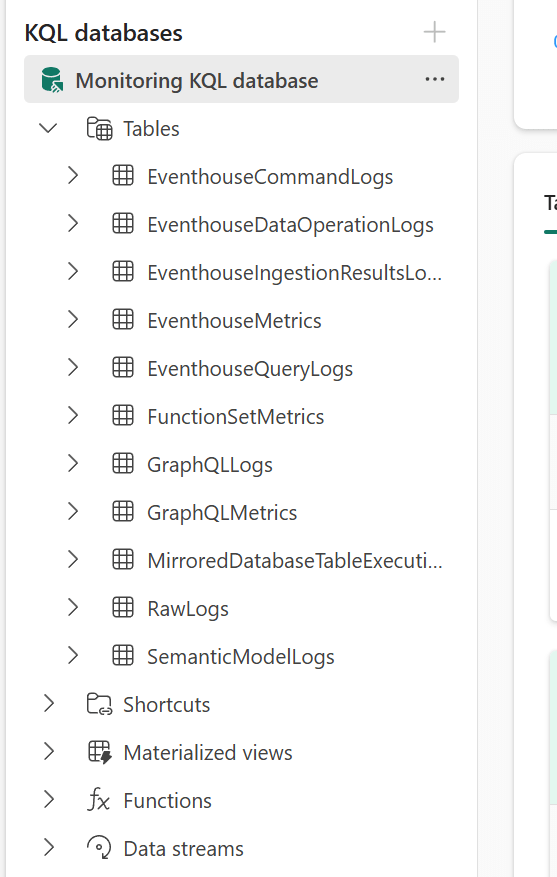
After a few moments, you should see something like this.
Are there any new resources in my workspace?
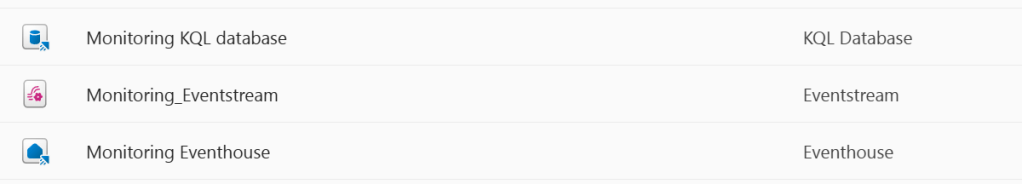
These resources are necessary to log and store the data.
Getting to the data
You can either click on the Eventhouse to open the database and start running your queries, or use the link shown to you after creating the Eventhouse database. Both will lead you to the data.
If you need help to get started, click here to go to the GitHub repository for sample queries.
Done?
So yes, these are the basics of Workspace logging. Or monitoring. Whatever you want to call it. Now it’s time to enjoy the video from Valerie!

One thought on “DP-700 training: Workspace logging”