In my previous blog, I wrote about some first impression working with Fabric and mostly following the Lakehouse tutorial provided by Microsoft. Well structured as this one may be, the sizes are not like the sizes I’m seeing in the wild. So I decided to give Fabric a bit more of a challenge by letting it loose on my TPC-H dataset.
The dataset
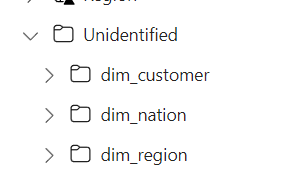
The TPC-H dataset has 8 different tables, pictured here as folders:
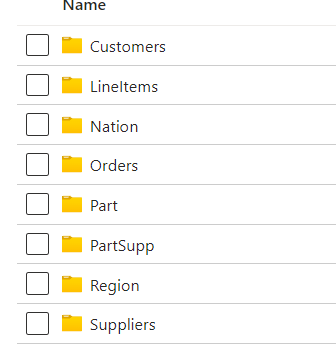
You can imagine the content of these tables. There is referential integrity between the tables but the information in the tables is completely random. Just some weird strings and numbers. The CSV size was about 520 GB, the parquet size is 263 GB. A lot smaller though not as much as I expected when transforming the data. Then again, splitting over 4335 files might not have been the most brilliant idea.
Importing CSV
As I found in the first run, importing CSV doesn’t seem like the best idea. But, maybe it changes with larger files. So I decided to import one of the Customer files. A little over 2 GB in data. As usual, most of my struggles came with connecting to my MCT powered Azure environment. Because it’s in a different tenant, using organisational accounts that are not invited won’t work. But a shared access signature works fine. I quickly created one and got the data. When the loading finished, it showed the table in an unidentified state for some time. It takes the OneLake some time to recognise the data and show it as a table. But, the 2,5 GB were processed in about 30 minutes.

Compared to 1-4 minutes for files that are around a megabyte, it indicates that the loading process takes some time to get started but after that de data can flow quite quickly into the Onelake.
Importing parquet
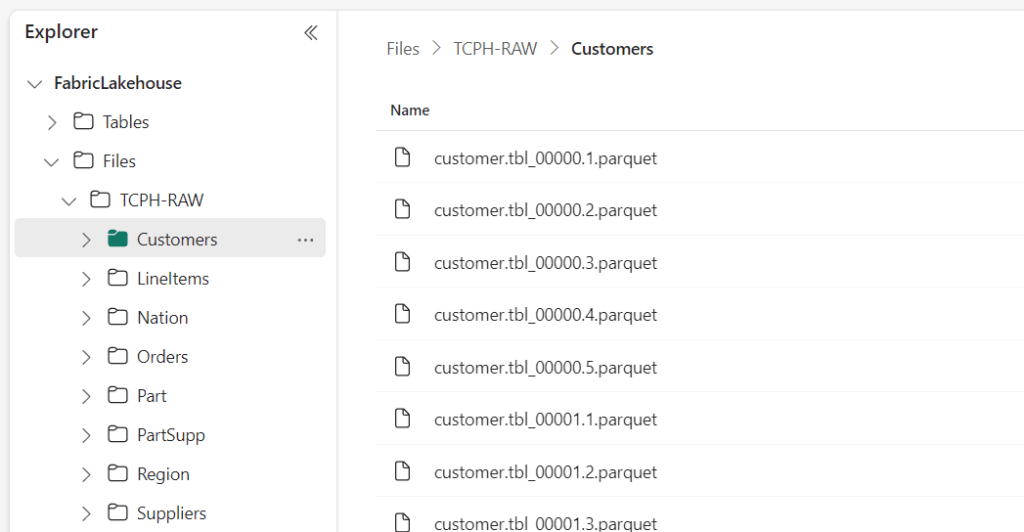
As the dataset had already been transformed to parquet files I could pick these up quite easily and write them to my Onelake as well. This wasn’t just one file but all of the generated files from my TPC-H test setup.

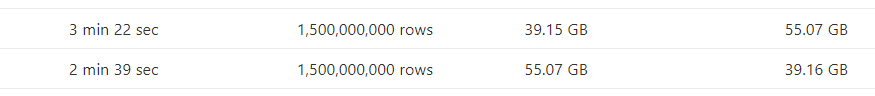
This throughput speed is between my Azure East US storage account and my Fabric environment in west europe. You can check out your region in the Fabric main page, going to Help and click on the about link:

I really like this breakdown of times, though I would like the extra option to see the time per file. Not useful in every scenario, but it can be a nice extra check.
Yay, I’ve got my tables :). So now I’ve got all my tables in my lake, can I see what’s in there?
Let’s create a Notebook, set some small stuff and read from my customers files:

So, I can do this for all my files but won’t bore you with that. All that changes are the names of the folders the data resides in. But in the above example, I read all the files and only displayed the first ten rows. What if I want to read just one file to get an idea of the columns in the table?
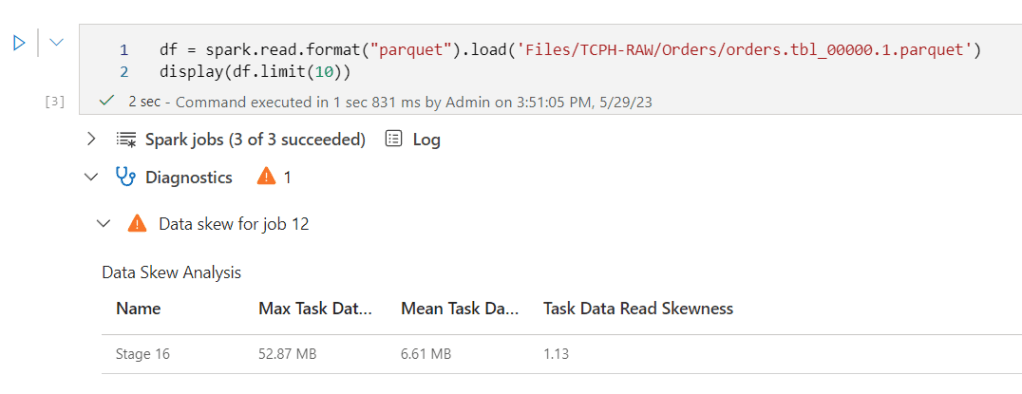
I get a message about data skew.
Now, let’s see what happens when I try and create an fact orders table based on all the files:
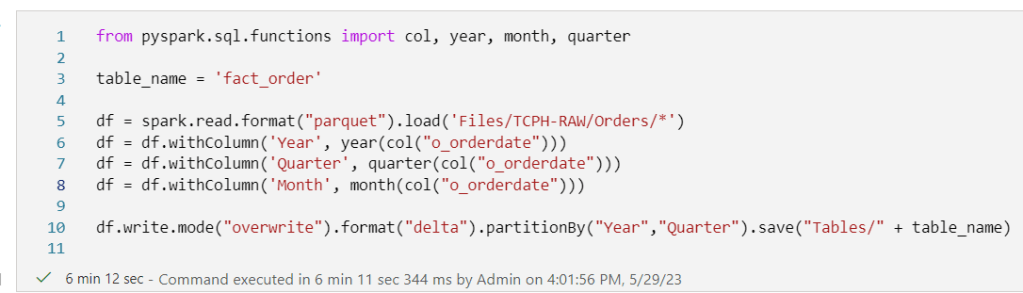
6 minutes a long time? Well, depending on the data size maybe?
Yes, I may have gone a little overboard with this amount of order rows. I hesitate to think what’s in the LineItems table. Then again, I already know from previous testing. Let’s check the loaded data first:

So 15 seconds to count 1,5 billion rows split over the different year, quarter and months isn’t too bad I think.
After creating my customer, nation and region dimensions I saw them in the unidentified state again:
In the SQL Endpoint mode of my lakehouse, I went to the model tab and created my model
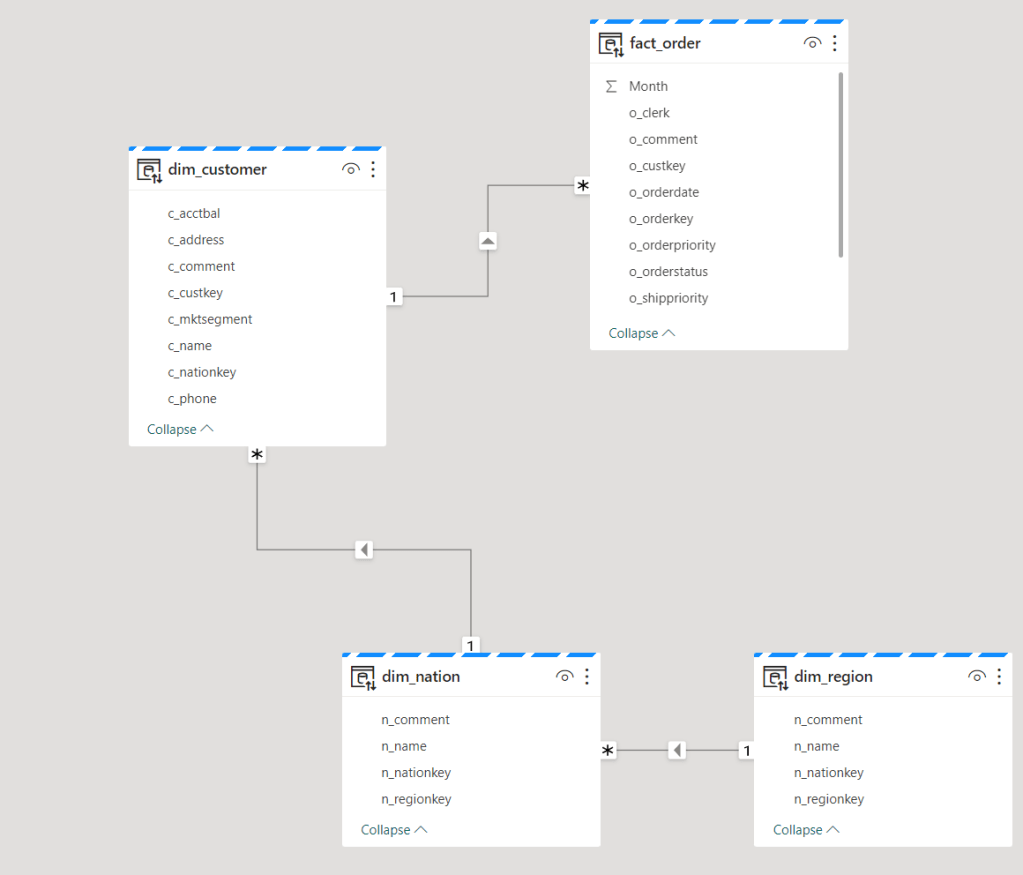
Based on this model, I should be able to create a report, right?
This is a genuine question as my regular work has already stopped here. My co-workers are exceptionally better in creating reports, but let’s give it a try.
And welcome to my world where apparently I forgot to change the datatype somewhere from varchar to decimal. It can probably be done somewhere in PowerBI, but I quickly jumped back to my safe space, this being SQL.
SELECT DR.r_name,
        DN.n_name,
        DC.c_mktsegment,
        SUM(CAST(FO.o_totalprice as decimal(16,4))) AS TotalOrderPrice
FROM [FabricLakehouse].[dbo].[fact_order] FO
INNER JOIN [FabricLakehouse].[dbo].[dim_customer] DC on FO.o_custkey = DC.c_custkey
INNER JOIN [FabricLakehouse].[dbo].[dim_nation] DN on DC.c_nationkey = DN.n_nationkey
INNER JOIN [FabricLakehouse].[dbo].[dim_region] DR on DN.n_regionkey = DR.r_regionkey
GROUP BY DR.r_name,
        DN.n_name,
        DC.c_mktsegment
ORDER BY DR.r_name,
        DN.n_name,
        DC.c_mktsegment
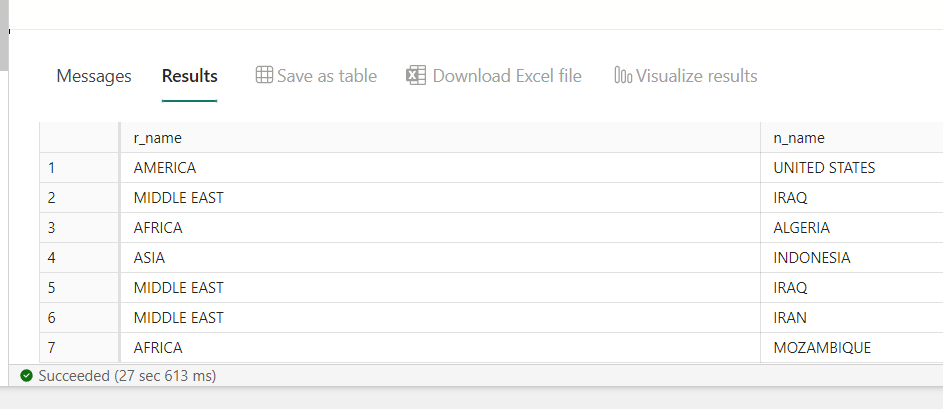
This script does exactly what it’s supposed to do for the report I wanted to create. So I let the query loose against my poor OneLake. Because aggregations and ordering over a large number of rows is hard at the best of times.

Well, this isn’t too bad to be honest. And I can both save the result as a table AND visualise the results. Let’s see what both options do.
Save as table

I’d call this a view but maybe I’m pedantic? Anyway it’s a really nice feature to add tables to your dataset without too much hassle or thinking about syntax.
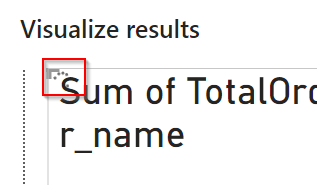
Visualise results
When you click the visualise button, another pop screen shows up.

As this is the query I created and I want to see the visual, I clicked Continue.
After some fooling around, I got this message:
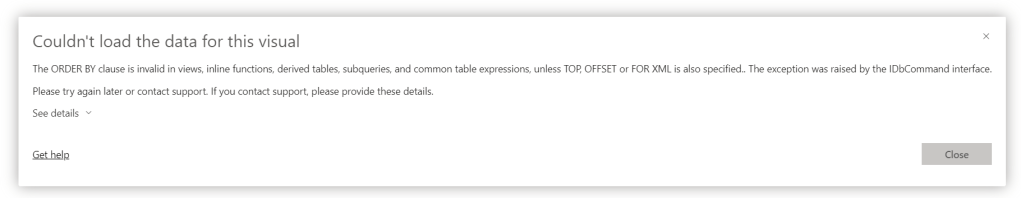
So I changed the query to get rid of the ordering and tried again to create a visual.
Without the ordering, the data returned much quicker, only 27 seconds instead of the earlier 2 minutes something.
When you build your report, data is loaded on the fly. You can see that with the running thingy in the upper left corner (I thought I had messed up my report because nothing started to show up).
After waiting for n amount of time, my graph showed up. And I remember why I don’t want to create reports. Or why I want an auto-create report in this screen. Because I came up with these settings:

Leading to this report:
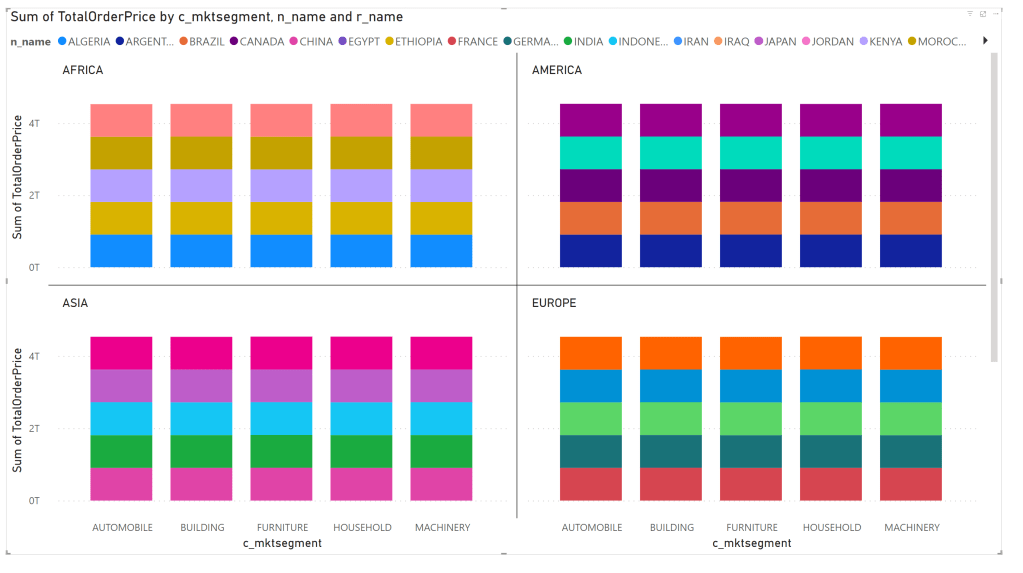
Your guess is better than mine, I just walk away when things like this happen. The information should be there but is messed up at some point. Let’s be clear, this shouldn’t be on the tool but on me. There’s a reason why most people don’t let me near any report and this might be the best visualisation of that reason. It’s full of colour though!
Lineage
According to all the documentation, one thing that should come with all this integrated goodness is lineage. Something that will be, always will be, very hard. I’ve checked out my lineage for the TPC-H tables.

This one nicely depicts the loading of the data. But it doesn’t connect my notebook to it where I transform the data to a dimensional table.
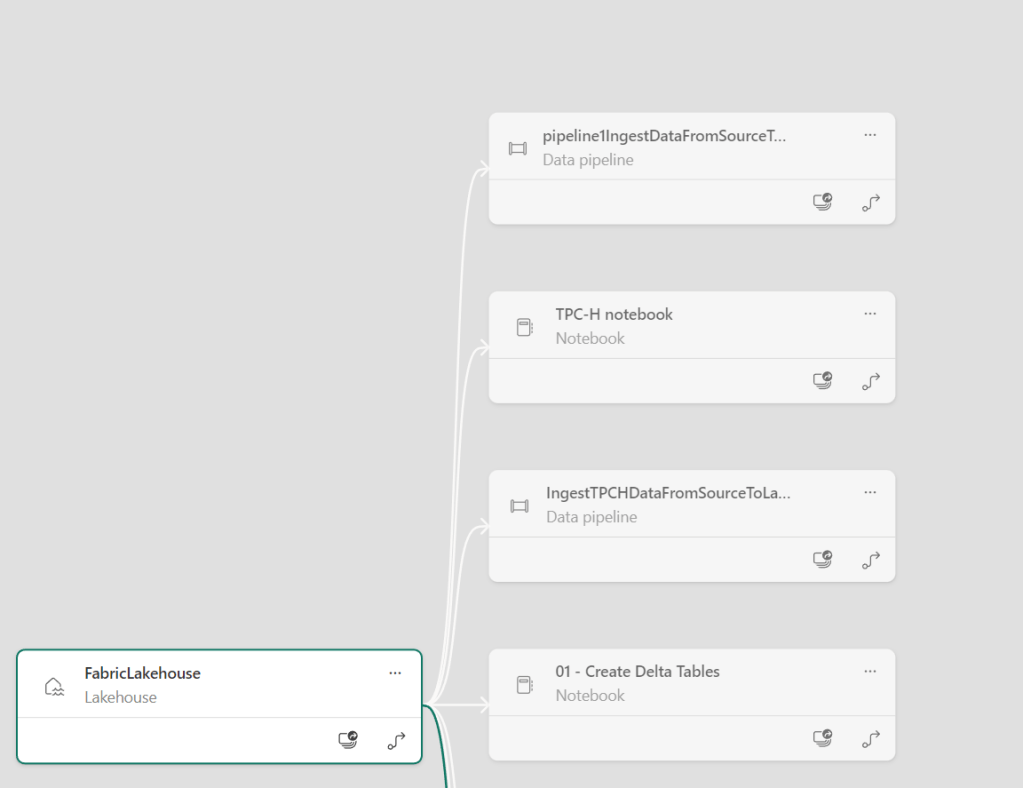
Even though it sees my TPC-H notebook. I’m convinced that adding the data through the API will enrich this lineage but I was hoping that this would work out of the box. Then again, maybe I need a report (that works ;)) first to create the lineage.
Big join
So after this small work, time to see what happens when I fire off the big join between the order table (1.5 billion rows) and the lineitem table (6 billion rows).
from pyspark.sql.functions import col, year, month, quarter

table_name = 'fact_orderline'

dforder = spark.read.format("parquet").load('Files/TCPH-RAW/Orders/*')
dforder = dforder.withColumn('Year', year(col("o_orderdate")))
dforder = dforder.withColumn('Quarter', quarter(col("o_orderdate")))
dforder = dforder.withColumn('Month', month(col("o_orderdate")))

dfline = spark.read.format("parquet").load('Files/TCPH-RAW/LineItems/*')

dforderline = dforder.join(dfline,dforder.o_orderkey == dfline.l_orderkey, how='Inner')

dforderline.write.mode("overwrite").format("delta").partitionBy("Year","Quarter").save("Tables/" + table_name)
My instinct was that the engine would just die, throw angry errors or in any other way misbehave towards me.
This is what happened.

I did not expect this. As this is a test dataset with dummy data, some rows will have joined, others not and maybe some joined multiple times, even though the program should sort that out. I don’t really mind to be honest, I’m not here to test for data quality (yet). Just processing an insane amount of rows and see what happens.
Ok, one quick test to see differences in the engine, a count(1) from Spark and a count(1) from the SQL side of things.
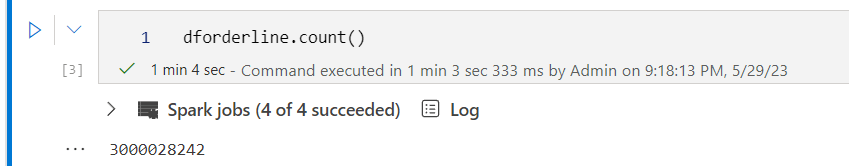

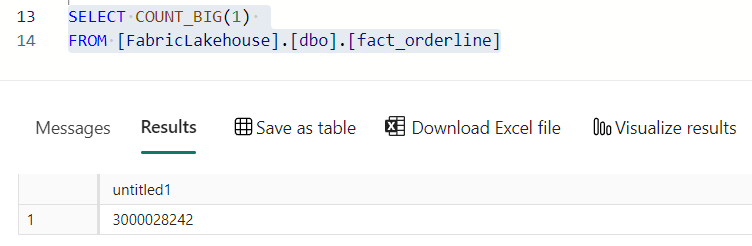

I’ll be honest, maybe counting from the dataframe is slower because it has to redo all the joins, and maybe doing the count warmed up the data for the SQL Query. But counting this amount of rows, 3.000.028.242, is no small feat. Weirdly, it’s only half of what the Spark feedback told me that was written out.
What did I learn
Getting data into the OneLake is fast, very fast. Compare it to loading data into a Hyperscale serverless instance here. The differences are huge, though truth be told, the technique is quite different. But in the end, the data is ready to be queried and visually presented.
Creating tables is easy, but be very wary of your data types. You don’t want to mess about with them in PowerBI I guess.
Writing SQL against the loaded tables is just like writing regular SQL. I’ll try and get more advanced on this later (things like CTE, windowing functions etc), but the basic syntax just works and it the performance is quite good thinking about the huge amount of rows it has process. Yes, I think tables with over a billion rows can be called huge.
Loading joined files into a new table is relatively easy and the performance is way above what I expected.
Building a model isn’t much harder than connection the two columns together from the tables. Done. After that, the front-end people can do their magic.
I really want to know more about the pricing of Fabric. From seeing what it can do and all the integration it has, I hope the pricing hasn’t got the same characteristics as the DTU model databases, being on a logarithmic scale almost.
Thanks for reading and I hope you’ll learn something from me fooling around :). If you have anything to add or share, please do so in the comments!

One thought on “Microsoft Fabric, fooling around with TPC-H data”