
I came across a fun feature in SSMS yesterday. A feature that helps out with a number of statistics around a query, and different ones than we usually activate when executing a query.
Setup
To see what this feature does, first my setup.
Usually if i want to see what a query does under the covers i do two things. First one is forget about the query results. I’ll check them once to verify i get the data i need. After that i’m usually only waiting on the network and presentation in SSMS. I’m not waiting on the database itself to complete it’s work.
To dump the query results you right-click in your query window and select query options:

Under Results – grid you’ll get the option to discard results after execution:

Second thing i’ll do is turn on statistics time and IO on and set the nocount on. These options will show me the time SQL Server needed to execute the query or queries, show me the amount of IO needed to gather the results and prevent the output of n rows affected.
Script
The script i’m using is based on AdventureWorks2014 and is running on my local pc. If you must know, a 7 year old Intel Core i5 with 20 Gigs of RAM and a number of SSD’s. This replicates the test i had to do for one of our projects and showes the issue i was facing; it took an awfull lot of time for query results to come back from the server.
SET STATISTICS IO, TIME ON
SET NOCOUNT ON


SELECT *
FROM HumanResources.Employee
CROSS JOIN HumanResources.Shift
CROSS JOIN HumanResources.JobCandidate
CROSS JOIN HumanResources.Department
No, this most certainly isn’t the script we were using, i’m only using this to show some effects. With the results, the script runs for 50 seconds, transferring 180.960 rows from the server to my SSMS client.

If we rerun the query but without the results, the query returns in 5 seconds.
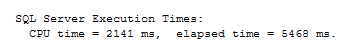
Ok, so preparing the query result takes 5 seconds, transferring it to SSMS takes 45 seconds.
But, how much data was transferred. To check this out, we need to activate the client statistics AND reactivate the results grid. Else you won’t see the amount of data transferred.

Or you can activate them from your query window

Click this button to include the client statistics and rerun the query. Your query will run for the same amount of time or maybe quicker because of the cached results.
What are the results
When the query finishes, you’ll get an extra tab in your results window.

Click it and you’ll get a number of new statistics:

In my case, i was looking for the amount of bytes received from server to determine the network speed. The number of rows is one thing, but i can’t easily tell if a row is 1 or 1000 kilobytes. By checking out the bytes received i can get some feel for the datasize. If there’s a huge amount of data coming towards me, that explains why i’ve got to wait for minutes. If there’s only a few kilobytes in the end, maybe something else is going wrong.
If you retry your query a few times, you can compare the results
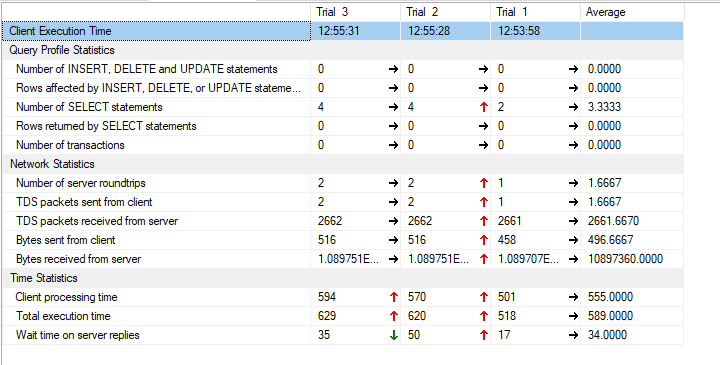
Now, the weird thing is this. When i execute the query without query results, i get this

The numbers don’t seem to be actual data, but the data size that’s expected to come to you. Because in this example, the query finished in 5 seconds, didn’t transfer a byte apart from the statistics but it still shows you got about a gigabyte of data. And that’s not true. Question is, how accurate are these numbers.
Trying to reverse engineer
To check this, i’ve gone with the sp_spaceused stored procedure.
  exec sp_spaceused 'HumanResources.Employee'
  exec sp_spaceused 'HumanResources.Shift'
  exec sp_spaceused 'HumanResources.JobCandidate'
  exec sp_spaceused 'HumanResources.Department'
The results
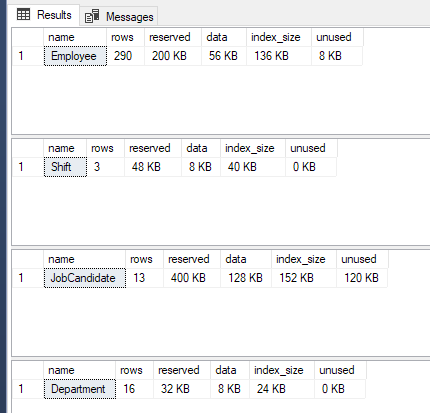
When cross joining, i’m joining every row on every row on every row. If you multiply 290*3*13*16 you get the 180.000 records shown previously. By that logic, the datasize should be calculated the same way. Now this is where the question start coming up. Because i get two different results if i multiply the data or the index_sizes:

Apart from finding that the stored procedures takes a look at uniform extents if more than one extent is used for the JobCandidates table, the numbers are useless.
Something that gets me closer is the number of reads.
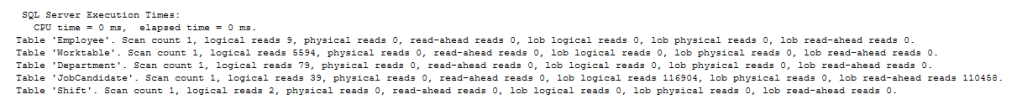
When i’m adding up all the reads and multiply them by 8 (every read is the read of a data page and one datapage contains 8 kb of data), i get this:
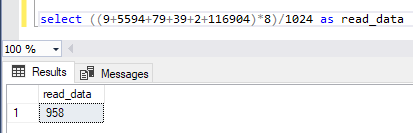
I had to take the lob logical reads into account to get somewhere near. Is this math correct? I don’t know. But i’m not sure about the client statistics either. There a 200 mb gap i’m not able to explain. It might be some sort of overhead.
Still, no luck. So finally i checked out the indexes and looked at the average and max data sizes. You can check these out in the index properties:


for each primary key index used in my query, i got the following results in megabytes:
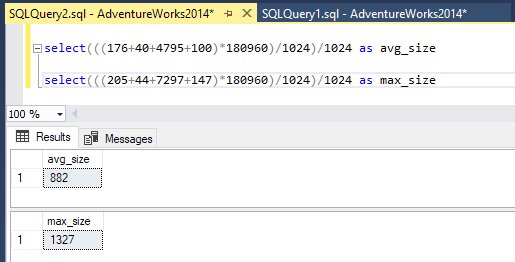
In the end, it looks like the client statistics checks out the datasize as it’s prepared on the server. It tell’s you it’s sending the data over, even when it’s not.
Conclusion
Usefull? It certainly has a lot of potential when debugging some issues. And it does help when you know beforehand that there’s an awfull lot of data waiting for you.
Thanks for reading, i hope this blog helps you out. If you think i’ve made a mistake, please let me know.

One thought on “SSMS Client statistics”