
We’ve all come to know and love the clustered columnstore indexes. They’re really great with getting data from a table, quickly, and performing aggregates. But what if you’re doing deletes and updates on the data? Well, that’s usually a bit nasty. But when I came across this blog by Aaron Bertrand (T), I found some pain relief.
The demo I’m using here is heavily based on the demo in his blog. Why? Because his demo suits the problem and it’ll make it easier to compare the results with his. I’m not showing how to create the table in my blog because I really want to encourage you to read his blog. I wouldn’t be surprised if all you need is already there. I’m using his blogpost as a jumping point for my own.
Where we go into different directions is the solution. Aaron promotes using stored procedures for the deletes. I’m not disagreeing, but with the tooling we’re using that’s not really an option.
The problem
Let’s start with the problem. We’re running heavy ETL loads during the night in a datawarehouse. Because reasons we have to insert, update and delete records on a daily basis and as it’s a large data warehouse, we’re talking about more than 10.000 records. The inserts are fine, but the updates and deletes take a lot of time. For my demo I’ve created the table as mentioned in Aarons blog and got to about 1 million rows. Just about enough for the columnstore index.
Suppose I’m running this query:
DECLARE @p1 int = ABS(CHECKSUM(NEWID())) % 10000000, @p2 int = 7;
DELETE dbo.FakeSuggestedEdits WHERE Id = @p1 AND OwnerUserId = @p2;
It results in this (I’ve omitted the results that were on 0 for readability)
Table 'FakeSuggestedEdits'. Scan count 2,  lob logical reads 411,  lob read-ahead reads 1192

Table 'FakeSuggestedEdits'. Segment reads 2, segment skipped 19.

SQL Server Execution Times:   CPU time = 16 ms,  elapsed time = 7 ms.
There are a number of reads, 2 segments that had to be read and a number of lob reads. All stuff that belongs to reading through a clustered columnstore index. As a regular user, you don’t care. What you want is a fast response. And 7 ms might not seem that much, but when you’re deleting a lot of data, it starts to add up, quickly.
A solution: add an index
Now, let’s add an index on the two columns that are used in the query. I’m not adding all the columns that are impacted, just the two that are mentioned in the WHERE clause of the query.
CREATE INDEX ncix_deletecols ON dbo.FakeSuggestedEdits (Id, OwnerUserId)
This takes about 5 seconds on my machine. Let’s run the delete again.
Table 'FakeSuggestedEdits'. Scan count 2, logical reads 9

Table 'FakeSuggestedEdits'. Segment reads 1, segment skipped 0.

SQL Server Execution Times:   CPU time = 0 ms,  elapsed time = 0 ms.
When SQL Server isn’t able to record time, it’s going faster I guess ;-). There are a lot less reads on the table. 1 Segment is being read, the rest has been skipped. I’m not yet 100% sure, but I wouldn’t be surprised if the nonclustered index nicely sorts the data helping the query engine find the record that has to be deleted.
Does this trick work with updates as well? Let’s find out!
/* drop the old index */
DROP INDEX ncix_deletecols ON dbo.FakeSuggestedEdits

DECLARE @p1 int = ABS(CHECKSUM(NEWID())) % 10000000, @p2 int = 7;
UPDATE dbo.FakeSuggestedEdits SET PostId += 1, ApprovalDate = DATEADD(DD, 1, ApprovalDate) WHERE Id = @p1 AND OwnerUserId = @p2;
When I run this query, this happens:
Table 'FakeSuggestedEdits'. Scan count 2,  lob logical reads 39932, lob physical reads 30

Table 'FakeSuggestedEdits'. Segment reads 2, segment skipped 19.

Table 'Worktable'. Scan count 1, logical reads 7,  lob logical reads 2,

SQL Server Execution Times:   CPU time = 156 ms,  elapsed time = 187 ms.
187 ms to update just one row. That’s a lot of time!
Let’s add an index to see what happens.
CREATE INDEX ncix_updatecols ON dbo.FakeSuggestedEdits (Id, OwnerUserId)
Again, creating the index takes about 5 seconds. I ran the same query again with these results
Table 'FakeSuggestedEdits'. Scan count 3, logical reads 19,  lob logical reads 6917

Table 'FakeSuggestedEdits'. Segment reads 2, segment skipped 0.

Table 'Worktable'. Scan count 1, logical reads 7, lob logical reads 2

SQL Server Execution Times:   CPU time = 0 ms,  elapsed time = 2 ms.
Take a good look at the measurements. The lob physical reads are gone, the lob logical reads went down from 39932 to 6917. But again, for the end user the elapsed time has dropped from 187 ms to 2 ms.
Done?
Well, before you run off to your server to add these indexes to all your columnstored tables, take a look at the next measurements. Because so far I’ve just run one delete and one update. I can’t imagine there’s a production server out there that does just that and sits waiting for the next one.
So I tried running SqlQueryStress. This resulted in the following matrix. Times are millisecond per delete or update. I’ve ran 1000 updates or deletes on 1, 16 and 32 threads to get these times.
                 Deletes                        Updates
Threads     1      16       32      Threads  1     16      32
NO NCIX  0,0006  0,002    0,0014         0,0063  0,0085  0,0146
   NCIX  0       0,0003   0,0003         0,0009  0,0012  0,0011
Deletes are much faster with an index ( averaging about 18 times faster), updates as well (averaging about 12 times faster).
Before you stop reading, please read the Finally paragraph at the end. You can skip the next part that tries to dig a bit deeper.
A little deeper
One thing I wondered about was the structure of my table. Because those LOB reads have something to do with my table structure. As a starting point, I used this query:
SELECT
    rowset_id,
    allocation_unit_id,
    allocation_unit_type_desc,
    allocated_page_page_id,
    is_mixed_page_allocation,
    page_free_space_percent,
    page_type,
    page_type_desc
FROM sys.dm_db_database_page_allocations(DB_ID(N'DEMO'), OBJECT_ID(N'FakeSuggestedEdits', N'U'), NUll, Null, 'DETAILED')
This will give me a result like this
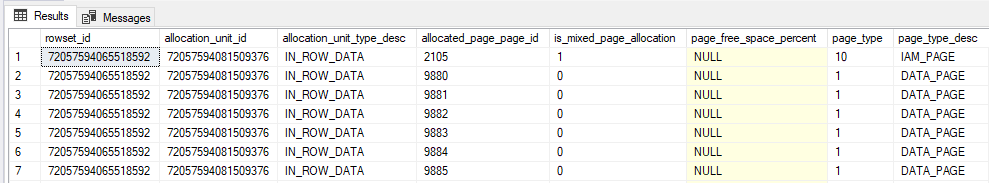
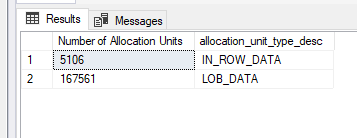
Let’s see what the page distribution is

The allocation unit type description will show me the number of LOB pages and IN_ROW_DATA pages.

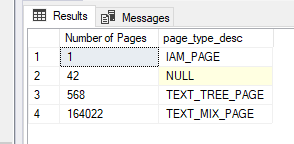
Let’s see what happens when I drop the nonclustered index.

The page allocations went down. As expected because every index is a copy of the data included in the index. And data lives on data pages. and every page needs an allocation.

There’s one IAM page gone, a lot of index pages have gone. The number of DATA_PAGE, TEXT_TREE_PAGE and TEXT_MIX_PAGE are the same. The index pages contained the nonclustered index data and SQL needed an extra IAM page for that. An Index Allocation Map (IAM) page maps the extents in a 4-GB part of a database file used by an allocation unit. My data doesn’t hit the 4GB part of the IAM definition, but with an index it needs an Index Allocation Map. But why three? Well, the table has been used for testing and multiple indexes have been added and dropped. It looks like there’s a lot of residue left after these processes. When I rebuild the columnstore index, this happens.
My IAM_PAGE count goes back to 1 (1 Clustered Columnstore Index, less than 4 GB), the index pages are cleared just like the data pages. The CCI saves the data in another way.
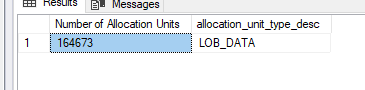
All there’s left are LOB_DATA allocation units. The IN_ROW_DATA allocation units are gone as well.
So, when I create a nonclustered index, the values from the index (both integers) are copied to IN_ROW_DATA allocation units. And sorted as well. That should be the explanation why a nonclustered index really helps out with update an delete operations. The engine can find the rows with less reads. When it finds the correct data in the IN_ROW_DATA, it will then go to the LOB allocation units to read/update/delete the LOB_DATA there. What I haven’t found is the write operations and impact on the delta stores. There’s a brilliant mind out there who will know how to do this.
Finally
Please don’t fool yourself into thinking this is the magical silver bullet to save all your performance problems. Because every problem has it’s own solution. Please test things like this out on your own system, check the results and the impact. Not just on the insert/update/delete part but also on the select.
Second, during testing, don’t forget to clean up after you. SQL won’t do it for you. And less clutter usually improves performance or prevents performance degradation.
Don’t stop your own experiments with just the indexes, there are more ways than one to solve your problems. If your application supports those by all means try them!
Lastly, thanks again to Aaron Bertrand for sparking this blogpost.
