Welcome to my blog series on Azure SQL DB performance. In this blog I’ll write about my findings with the Azure SQL DB General Purpose Serverless tier. Quite a mouth full.
Click here for information about the set-up
Click here for the scripts I’ve used
Intro
In my previous blog I wrote about the premium tier, the one that can be compared with the business critical tier. Now we’re moving away from the DTU models and back to what we DBA’ers really understand, cores, memory and disks. Before I’m going to dive into the limitations, there’s one thing you need to understand. The serverless tier is made for intermittent use. If you’re using the tier for more than 25% of the time (or about 183 hours per month), you’re better of going provisioned. This has nothing to do with performance but everything with cost. The tipping point of provisioned being cheaper is around 25% of the time.
Serverless sleep mode
If you’re working with serverless, there’s a setting that the database will go to sleep in a certain amount of hours. The minimum is 1 hour. If nothing happens on the database during this time, it will go to sleep and stop costing compute money. Circling back to the amount of hours you’re using the database, these hours count as well.
I’ve had some issues where I left my SSMS window open and therefore the database active. Not a smart move when going into the weekend. I was convinced it had something to do with the query window, but when presenting the session that accompanies this blog series, Erland Sommarskog pointed me to a better explanation. It might not be the query window, but the object explorer or intellisense. He’s never using these two options in SSMS and saw that his serverless databases went to sleep. So I shut down the object explorer and saw the database going to sleep.
Limits
The serverless tier starts at 2 cores with ½ as a minimum and goes up to 40.
The maximum storage starts at 512 GB and goes up to 4 TB. The number of TempDB files is undisclosed but the size starts at 32 GB and goes a little over 1 TB. The disk limitations are disclosed as well. Log rate starts at 4.5 Mbps and maxing out at 50. The same goes for the data; starting at 320 iops and maxing out at 12.800. One iop (or Input Output oPeration) is connected to the disk cluster size. As these are 4 kb, reading or writing one data page (8Kb) equals two iops. 320 Iops equals something of 1 MB per second. The top end goes to about 50 MB per second. Keep this in mind when you’re working out which tier you need, because usually disk performance can be essential.
Resources provided
I’ve deployed all the standard options and got the following results:
If you’re looking at these numbers, there are quite a few weird things happening.
| SKU | Memory | CPU Cores | Max workers | Schedulers | Scheduler total count |
| GP_S_Gen5_1 | 1 | 2 | 20 | 2 | 11 |
| GP_S_Gen5_2 | 4 | 2 | 26 | 2 | 9 |
| GP_S_Gen5_4 | 9 | 4 | 32 | 4 | 12 |
| GP_S_Gen5_6 | 14 | 6 | 64 | 6 | 14 |
| GP_S_Gen5_8 | 19 | 8 | 64 | 8 | 16 |
| GP_S_Gen5_10 | 24 | 10 | 20 | 10 | 21 |
| GP_S_Gen5_12 | 30 | 12 | 26 | 12 | 23 |
| GP_S_Gen5_14 | 35 | 14 | 32 | 14 | 25 |
| GP_S_Gen5_16 | 40 | 16 | 32 | 16 | 27 |
| GP_S_Gen5_18 | 45 | 18 | 32 | 18 | 29 |
| GP_S_Gen5_20 | 50 | 20 | 64 | 20 | 36 |
| GP_S_Gen5_24 | 61 | 24 | 24 | 24 | 32 |
| GP_S_Gen5_32 | 81 | 104 | 26 | 32 | 118 |
| GP_S_Gen5_40 | 103 | 128 | 32 | 40 | 142 |
Memory and CPU start to increase slowly at the bottom but go wild at the top end. The amount of schedulers, that in my opinion determines the amount of work the database can do, has a much more balanced growth and are in line with SKU description. Every scheduler is ‘bound’ to a cpu core. It should be that the amount of schedulers represents the amount of cores. Yes, there are hidden schedulers but these should be hidden from the used view as well.
The amount of workers on the other hand is a bit wonky. I have no idea what’s causing this behavior and I’ve seen different results with identical deployments. When we look at query performance, there might be a relation between performance and amount of workers. The workers are the ones doing the work for the schedulers. But with less workers, the schedulers seem to be done.
One way of checking if the the workers and schedulers can change in your favor is by changing the SKU as far up as it can to see if you can get it to move to another node. Then change back down to your preferred SKU and check the results. It isn’t pretty but it might be quicker than submitting a call to Azure support.
Running query’s
We’re not using a database to sit around idle, we need to insert, read, delete and update data (in whatever order you fancy). When you look into the code post, you’ll find the scripts I’ve used to do just that. Insert a million rows, try and read a lot of stuff, delete 300.000 records and update 300.000. The reads, updates and deletes are randomized. Because of the large number, I think the results are useable and we can compare them between tiers and SKU’s.
Insert 1 million records
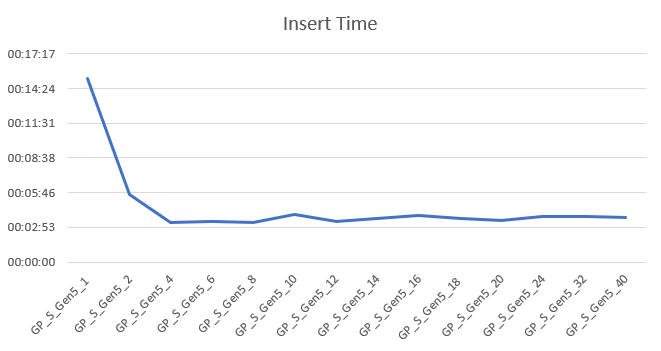
I’ve insert the records on all SKU’s within this tier. With 1 core, this took 15 minutes, from 4 cores and up it was done between 3 and 4 minutes. It’s funny that increasing cores doesn’t add any extra insert performance. It does prove that throwing more hardware at your solution doesn’t necessarily improve performance. When running these query’s, I noticed that the process goes off to a flying start and then slowly reduces speed the more changes have to be done to the index. The larger the index grows, the more time it takes to add data to the page or shuffle pages around to keep everything in order.

Wait types I’ve seen the most:
- WRITELOG
- SOS_SCHEDULER_YIELD
- PAGEIOLATCH_EX
- PAGELATCH_EX
- XE_LIVE_TARGET_TVF
- PWAIT_EXTENSIBILITY_CLEANUP_TASK
- PAGELATCH_SH
- PAGEIOLATCH_SH
- RESOURCE_GOVERNOR_IDLE
- PREEMPTIVE_HTTP_REQUEST
- BACKUPIO
This is quite the list. The inserts is waiting on the logging for over half of the time. The query having to leave the scheduler is a little under 20 percent of the time. Getting exclusive rights to the pages amounts to about 15 percent of the wait time. The eXtended Events waits and machine learning services waits are less than 5 percent of the total wait time and are less significant when you’re looking for improvements. The backup wait registered for less than 1 percent in my measurements. This can be explained by looking at the duration of my process (less than 5 minutes) and the interval of the backups (every 5 minutes). I seem to have been lucky in most runs that the backups happened either outside my process window or early when there wasn’t all that much data to backup. I’ve seen these backup processes hit hard in my regular work, so don’t underestimate these.

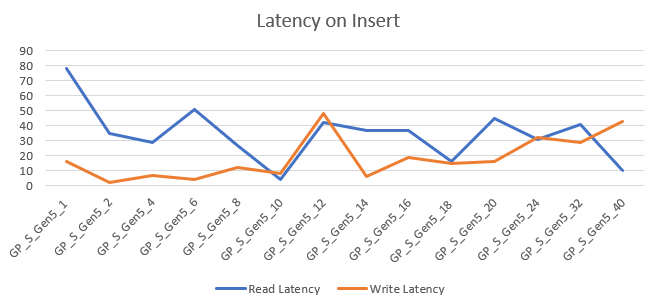
The read and write latency varied between 8 and 75 ms. It really varies and has hardly a relation with cores. If you go for the lowest tier, you’ll encounter the highest latency, when you start scaling up, latency can go all over the place. Depending on your workload, this can be either something do dive deep into or to keep in the back of your mind.
Select data
After inserting data, it was time to select some. The script that I’ve used is intentionally horrible to make the worst of the performance. The 1 core DB took 30 hours to complete. Just like the inserts, you can see enormous increases at the low end but the more you increase, you get less extra performance. The 40 core SKU finished in just over 48 minutes. Like the previous graph, the more cores you add, the less extra performance is gained. But every core added does increase performance. Every time we double the amount of cores, the time needed to complete is halved. That’s quite impressive to be honest, because there hasn’t been any tuning and the runs are always fresh; no cached plans for example.

The wait types I’ve seen the most:
- SOS_SCHEDULER_YIELD
- CXPACKET
- LATCH_EX
- RESOURCE_GOVERNOR_IDLE
- XE_LIVE_TARGET_TVF
- PWAIT_EXTENSIBILITY_CLEANUP_TASK
- HADR_FABRIC_CALLBACK
- PAGEIOLATCH_SH
This time round the waits are on reaching the maximum time a query can spend on the processor (4ms). This was almost 50% of the time over all SKU’s. Next up parallelism. These waits became more prevalent in the higher SKU’s with more cores. Note that you really need to keep your parallelism in check, or allow for these waits. Getting exclusive access to data pages to less than ten percent of the time, the resource governor (the way Azure is limiting the resources on the databases took about three percent of the wait time. These were higher in the low end and less in the high end. The xe_live_target_tvf wait amounts to about 1,5 percent of the wait time. It’s good to know it does take some time though it shouldn’t interfere much with your running query’s. The same goes for the other three waits. Good to know they’re there but not something to really worry about.

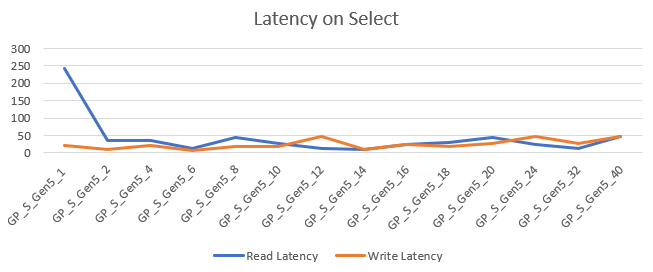
The disk latency was anywhere between 9 en 242 ms. The latency averages around 28 ms for both read and write operations. The outlier with the one core database must be treated as such.
Delete data
After selecting data I decided I had enough of the large amount and had to trim some of. So I deleted 300.000 records. This process is quick all over the board, ranging from a little under three minutes to 20 seconds at best. The gains from 6 cores and up were very little as you can see in the graph. Just like the DTU tiers, at some point adding more cores doesn’t really help anymore.

The wait types:
- PAGEIOLATCH_EX
- VDI_CLIENT_OTHER
- WRITELOG
- XE_LIVE_TARGET_TVF
- PVS_PREALLOCATE
- PWAIT_EXTENSIBILITY_CLEANUP_TASK
- RESOURCE_GOVERNOR_IDLE
- PAGELATCH_EX
- LCK_M_IX
- SOS_SCHEDULER_YIELD
- PAGELATCH_SH
- PAGEIOLATCH_SH
- BACKUPIO
- PREEMPTIVE_HTTP_REQUEST
- LATCH_SH
It’s not really a surprise that most of the waits (40%) come from waiting on exclusive access to data pages. The second one is a weird one, having to do with triggering a database copy. Thing is, I didn’t do it on purpose so this might come up when I’m involuntary moved from one server to another. That one took 21% of the wait time. It’s no surprise that deletes are logged, so 15% write log wait is to be expected. The extended events live view had almost 7 percent of wait time followed by the background task for accelerated database recovery. The other waits are less than 5 percent of the time and, regarding the total time, are less relevant. You can read all about them through the links.

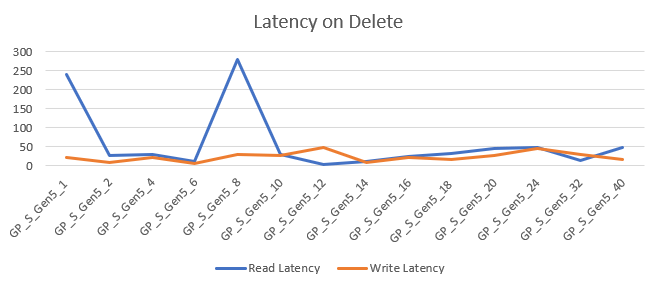
The disk latency was between 3 and 240 ms. In this case, the latency went all over the place with outliers and other weird numbers. I’m hesitant to add any conclusions to these numbers because of the short duration of the query’s. The latency averages at 26 ms for read and 23 ms for writes.
Update data
The last job I let rip on the database was an update task. I ran a script to update 300.000 records. The 1 core took two and a halve minutes, from the 6 cores and up went around 20 seconds and just stayed there. The behavior is quite the same as with deletes.

Let’s take a final look at the waits
- PAGELATCH_EX
- PWAIT_EXTENSIBILITY_CLEANUP_TASK
- HADR_FABRIC_CALLBACK
- VDI_CLIENT_OTHER
- XE_LIVE_TARGET_TVF
- RESOURCE_GOVERNOR_IDLE
The main wait is again exclusive access to a datapage to modify it. This wait took almost 50% of the time. Second is waiting on the lanchpad service that has to do with SQL Server machine learning services. The third one, with 14% of the time is a new wait that has to be determined but has to do with availability groups. The rest of the waits are quite low in time and relevance, though it is notable that the resource governor manages to pop up for about 2 percent of the time.

The latency is comparable with the update graph. Again a spike on 8 cores and a relatively stable line for the other SKU’s. Both read and write latency’s average around 25 ms (without the outliers).
Pricing
The prices of the serverless databases have been calculated for 24/7 usage. In the real world this is something you should never do. As I wrote at the start of this blog, if you’re going serverless, make sure it’s on for about 25% of the time. If you’re going above that go provisioned.
The pricing shows a quite stable line up to 24 cores. When you’re choosing 32 of 40 cores, the price graph becomes somewhat steeper. But all in all it should be quite predictable where you’re ending up.

The curve is not as opposite to performance as the premium tier. But more performance will cost more and you’ll have to decide if this tier and it’s SKU is worth the cost. To keep this under control I’d advise you to use the cost center and it’s alerts. Not only the actual costs, you can create cost alerts on predicted costs as well to prevent surprises. We’ve all been there.
Finally
Would I use this one for my use cases? We’re using this tier and different SKU’s for most of the testing environments. These aren’t running full time (or shouldn’t be). Some databases in production that drop under the 25% rule of being used are sometimes put in this tier as well. Running databases in Azure can be a costly, things like this can be excellent cost savers.
Thanks for reading, next week General Purpose Provisioned!
One thought on “Azure SQL Database Performance comparison part 4 of 9: General Purpose Serverless”