
Welcome to my blog series on Azure SQL DB performance. In this blog I’ll write about my findings with the Azure SQL DB Business Critical tier.
Click here for information about the set-up
Click here for the scripts I’ve used
Intro
My last blog was about the Hyperscale tier, this week we’re back at more regular designs with Business Critical. This design is aimed at performance, local SSD storage and better CPU’s. But that’s not all. Besides this high-speed design, it also has high availability implemented by having a secondary replica ready to take over when the primary fails for any reason. And not just one but three replicas. So, your data should be accessible at all times. To make it even better, you can make one of these replica’s the read-only replica for reporting purposes. I’ve tested most tiers, again I didn’t test the 80 cores SKU because of the price. I also did some testing with and without replica’s but there wasn’t much of a difference. But again, my testing setup is quite simplistic, for your heavier read and write loads it might make a huge difference.
Limits
The business critical tier starts at 2 cores as a minimum and goes up to 80. Storage starts at 1 TB and can grow to 4 TB. This tier is for fast compute and high availability and less about large amounts of data. The number of TempDB files is undisclosed but the size starts at 64 GB and goes up to 2 TB. The disk limitations are disclosed as well. Log rate is 24 Mbps At the low end and goes up to 96 Mbps. The same goes for the data, starting at 8000 iops and maxing out at 204.800. One iop (or Input Output oPeration) is connected to the disk cluster size. As these are 4 kb, reading or writing one data page (8Kb) equals two iops. 8000 Iops equals something of 32 MB per second. The top end goes to about 800 MB per second. This speed, compared with local SSD should make sure you get to a lot of data quite quickly. Of course, these are the maximum values, it’s possible your results can turn out a bit lower.
Resources provided
I’ve deployed all the standard options and got the following results:
If you’re looking at these numbers, there are quite a few weird things happening.
SKU | Memory | CPU Cores | Max workers | Schedulers | Scheduler total count |
| BC_Gen5_2 | 7 | 2 | 32 | 2 | 17 |
| BC_Gen5_4 | 16 | 4 | 24 | 4 | 22 |
| BC_Gen5_6 | 25 | 6 | 32 | 6 | 25 |
| BC_Gen5_8 | 34 | 8 | 32 | 8 | 26 |
| BC_Gen5_10 | 43 | 10 | 32 | 10 | 29 |
| BC_Gen5_12 | 52 | 12 | 20 | 12 | 31 |
| BC_Gen5_14 | 61 | 14 | 20 | 14 | 33 |
| BC_Gen5_16 | 70 | 16 | 32 | 16 | 34 |
| BC_Gen5_18 | 79 | 18 | 26 | 18 | 36 |
| BC_Gen5_20 | 88 | 20 | 32 | 20 | 38 |
| BC_Gen5_24 | 108 | 24 | 26 | 24 | 43 |
| BC_Gen5_32 | 147 | 80 | 20 | 32 | 102 |
| BC_Gen5_40 | 187 | 80 | 20 | 40 | 101 |
Memory has a quite stable rate with which it increases. That gives some form of predictability but as a DBA, I like lots of memory.
At 32 and 40 cores there are more cores available to the ‘instance’ than being used. Hello resource governor. The amount of max worker has some weird behavior but not as wild as I’ve seen in other tiers. The number of schedulers, that in my opinion determines the amount of work the database can do, has a much more balanced growth and are in line with SKU description. Every scheduler is ‘bound’ to a cpu core. It should be that the number of schedulers represents the number of cores. Yes, there are hidden schedulers but these should be hidden from the used view as well.
Running query’s
We’re not using a database to sit around idle; we need to insert, read, delete and update data (in whatever order you fancy). When you look into the code post, you’ll find the scripts I’ve used to do just that. Insert a million rows, try and read a lot of stuff, delete 300.000 records and update 300.000. The reads, updates and deletes are randomized. Because of the large number, I think the results are useable and we can compare them between tiers and SKU’s.
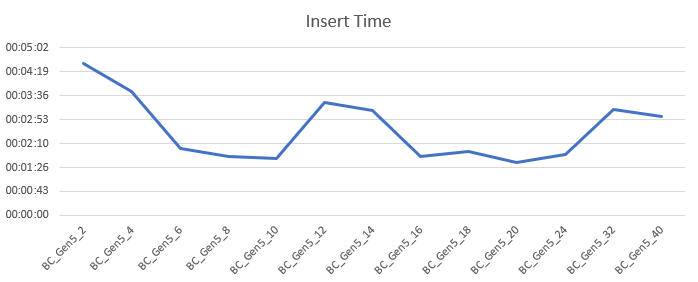
Insert 1 million records
I’ve inserted the records on all SKU’s within this tier. With 2 cores, this took a little over 4 minutes. The times decreased but at 12 cores the times suddenly went up and started going down again. At 32 times went up again with a small decrease at 40. The rise in times seems to be related to the fact that the database was being moved around (the VDI_CLIENT_OTHER wait). This shouldn’t occur all that often. The impact is high enough across all the query’s to be discarded as edge case or outlier though.
Wait types I’ve seen the most:
I’ve omitted the VDI_CLIENT_OTHER wait that was the biggest one. I’m mentioning it to make you aware of it’s existence but I don’t want to let it mess up the other results. The one that came next is the wait that makes sure the replicas are populated with data. This one took about 38 percent of the time. Next ones are access to data pages, both shared and exclusive coming in at 32 and 16 percent of the time respectively. Then the engine spends 5 percent of the time on extended events for the Azure portal and finally 3 percent on writing data to the log file.
Let’s see what happens on the disks latency-wise.

Well, this can be quite short, the latency is excellent over the board with an outlier at 4 ms. Average read latency 1.4 ms, average write latency 0.3 ms. These disks are quick. Again, this is what you ask and pay for, but for me it’s nice to see that these disks won’t put up a struggle when inserting data. We’ll see the spike at 12 cores in more graphs, there seems to have been a small issue in the background. Keep your wait stats in check the minute you see unexpected behavior.
Select data
After inserting data, it was time to select some. The script that I’ve used is intentionally horrible to make the worst of the performance. The 2 core DB took 17 hours and 5 minutes to complete. The 40 core SKU finished in just over 52 minutes. It’s comparable to Hyperscale but slower than the compute optimized general purpose. Like other tiers, it’s a bit of an asymptote. The increase of speed slows down and at some point more hardware won’t get you anywhere quicker.

The wait types I’ve seen the most:
- SOS_SCHEDULER_YIELD
- CXPACKET
- VDI_CLIENT_OTHER
- CXSYNC_PORT
- LATCH_EX
- XE_LIVE_TARGET_TVF
- RESOURCE_GOVERNOR_IDLE
The main wait had to do with query’s having to leave the processor. Remember the horrible query I wrote? That’s why it takes 35 percent of the time. Second is parallelism. I didn’t do anything with max dop, query tuning or statistics refreshing, so this is expected and at 18 percent of the time, not all that bad. The moving of my database took about 18 percent of the wait time as well (removing the wait time didn’t have much impact on my percentage calculations). There’s a second wait type for parallelism (and your primer to make sure you look into that) with 16 percent of the time followed by exclusive access to memory objects at 5 percent. Again we need to populate the Azure portal with data at about 2 percent of the time and finally we run into the resource governor at about 2 percent as well.
Let’s take a look at the latency
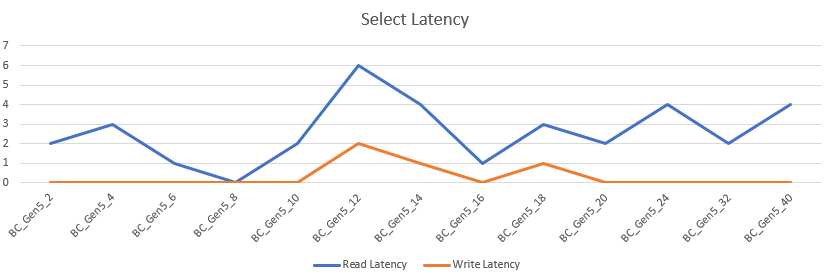
Apart from the weird jump at 12 cores, it’s flying. Averaging at 2,6 ms read latency and 0,3 ms write latency the disks remain incredibly quick.
Delete data
After selecting data I decided I had enough of the large amount and had to trim some of. So I deleted 300.000 records. This process is quick all over the board, except for the 2 core machine that needed a minute. The 4 core machine halved the time, after that the duration swung around the 14 seconds mark.

The wait types:
- HADR_FABRIC_CALLBACK
- XE_LIVE_TARGET_TVF
- PWAIT_EXTENSIBILITY_CLEANUP_TASK
- HADR_SYNC_COMMIT
- PAGELATCH_EX
- PVS_PREALLOCATE
- RESOURCE_GOVERNOR_IDLE
- LCK_M_IX
- WRITELOG
As the query is modifying data, this needs to be persisted over all the replicas. Hence it’s at the top of the list with 52 percent of the time. Next with 18 it’s the population of the Azure portal followed at 8 percent with some background machine learning service. Next comes the second wait that has to do with the availability group at 5 percent. Exclusive access to pages at 4 percent seems quite low in respect to the others, just like the other waits.
All in all not too bad I think. Keep in mind that the query’s finish really fast, meaning getting wait stats is a bit harder.

Apart from the weird jump at 12 cores, it’s flying. Averaging at 2,1 ms read latency and 0,3 ms write latency the disks remain incredibly quick. At the high end, there’s a jump but at 4 ms I wouldn’t really worry about it. There are bigger issues to tackle.
Update data
The last job I let rip on the database was an update task. I ran a script to update 300.000 records. The 2 core took a little over a minute seconds, 40 core took 19. The behavior is quite the same as with deletes.

Let’s take a final look at the waits
Exclusive access to the data pages is the most prevalent wait type at 89 percent. The Azure portal takes 7 percent of the time and the background machine learning about 2 percent. Updates aren’t all that exciting in my test setup it seems.
Let’s see if the disk latency is as weird as it was with the deletes.

The latency is identical to the updates. So no wasted words here.
Pricing
The pricing shows an even line over the different SKU’s. The breaks you’re seeing in the lines are caused by the uneven rises in cores. In the end, you’re paying a price per core (187,41 in my case) so there’s predictability again.

More performance will cost more and you’ll have to decide if this tier and it’s SKU is worth the cost. To keep this under control I’d advise you to use the cost center and it’s alerts. Not only the actual costs, you can create cost alerts on predicted costs as well to prevent surprises. We’ve all been there.
An extra warning as from October. As energy prices rise, so do the prices of Azure resources. I’ve seen increases in price for various resources including databases and VM’s. Both in pay as you go and in reserved instances.
Finally
The business critical is suited for workloads that need to be online for 5 nines or more. Read scale out and failover are built in by default. The local SSD makes short work of reads and writes. All these features together offer a fast and reliable platform for your data. Unless the scaling runs into some weird behavior. I would add that to my monitoring as a poison wait, just to be sure this one doesn’t strangle all the needed performance. As long as your data volume remains under 4 TB, you’re making a good choice. Keep a watchful eye on the different waits, not only the VDI_CLIENT_OTHER but the RESOURCE_GOVERNOR_IDLE as well. Hitting the first one might mean your database is moving across servers, the second one means you need more than the database is allowed to offer and an up-scale might be needed.
Thanks for reading, next time I’m digging into the Managed Instance.

One thought on “Azure SQL Database Performance comparison part 8 of 9: Business Critical”