With an unsatisfying end.
Intro
So what’s up this time. Our client has moved to Azure in classic lift and shift scenario. Well, almost. They’ve deployed new VM’s and installed SQL Server 2019 Standard in nice DTAP setting. The VM’s are standard E16-4as-v4 SKU. 4 vcpus and 128 GB memory. The disks are Premium SSD LRS ones with 2300 Max IOPS.
Their on-premises environment was a SQL Server 2016 standard edition running on a virtualisation layer with 128 GB of memory and 8 cores.
In both cases there are 2 numa nodes dividing the amount of cores between them.
Query
The client is using a reporting tool that is, like any tool, able to create the most horrible syntax but in this case it’s quite simple. Thanks to Plan Explorer, I can share the syntax.
SELECT
  Object1.Column1,
  sum(Object2.Column2),
  Object2.Column3,
  sum(Object2.Column4),
  sum(Object2.Column5),
  Object3.Column6,
  Object3.Column7,
  Object3.Column8
FROM
  Object4  Object5 INNER JOIN Object6  Object2 ON (Object2.Column9=Object5.Column10  AND  Object2.Column11=0)
   INNER JOIN Object7  Object3 ON (Object3.Column12=Object2.Column12)
   INNER JOIN Object4  Object8 ON (Object8.Column10=Object2.Column13)
   INNER JOIN Object9  Object10 ON (Object8.Column10=Object10.Column10)
   INNER JOIN Object11  Object1 ON (Object10.Column14=Object1.Column14  AND  Object1.Column15!='Fixed value')

WHERE
  (
   Object5.Column16  <>  'Unknown'
   AND
   Object1.Column1  =  'Fixed Value'
   AND
   Object3.Column17  >=  DATEADD(MONTH, DATEDIFF(MONTH, 0, DATEADD(YEAR,-2,GETDATE())), 0)
  )
GROUP BY
  Object1.Column1,
  Object2.Column3,
  Object3.Column6,
  Object3.Column7,
  Object3.Column8
When ran on the on-prem server, the query completes in about 2 seconds.
SQL Server Execution Times:
CPU time = 12935 ms, elapsed time = 2049 ms.
When ran on the Azure VM, the query completes in about 50 seconds.
SQL Server Execution Times:
CPU time = 10610 ms, elapsed time = 51039 ms.
Even though the amount of CPU time is less, the elapsed time is ridiculously higher.
Execution plan
so I decided to dig into the execution plan and see what’s happening.
This is from the on-premises server:

And this is what the Azure VM produced:
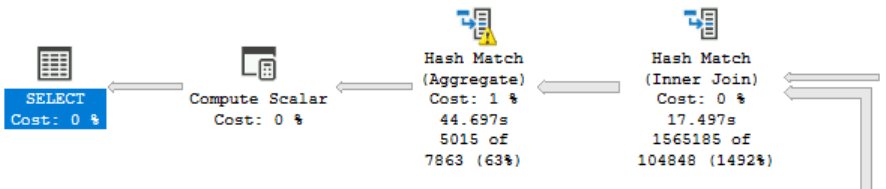
The yellow exclamation mark telling me it needed to write stuff to disk. More importantly, the Azure VM didn’t go parallel. At any point. But why. There are functions that can prevent the query from going parallel, but it should have done so in both environments.
There must be some reason why this one refuses to go parallel. Both instance and database degree of parallelism settings are on 0. There is no processor affinity masking happening and even with a query hint OPTION (Maxdop 4) the plan refuses to go parallel. Even better, the execution plan doesn’t even hint on why it did this. All it says is this:
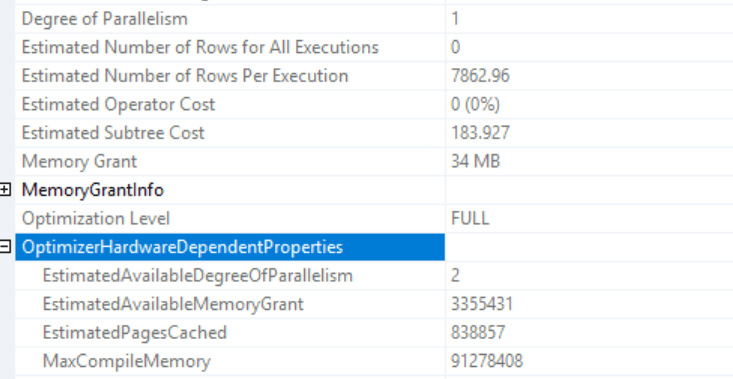
I know it has a Degree of Parallelism of 1, but the EstimatedAvailableDegreeOfParallelism is 2. Not 4. So even when it could go parallel it didn’t, but if it could, it would only start working on 2 cores? It feels like the estimated amount is tied to the number of cores in the numa node, all other servers show the same behaviour.
I’ve heard something about the E-series VM, it being that as the cores are hyperthreaded, they might not be as efficient as you’d hope. Thing is, I can’t really find evidence for this and moreover, when the client moved one of the DTAP machines to a different SKU, this happened.
POWERRRRR
As I was comparing apples with oranges because of the difference in cores, I asked the client if they could change a VM from a 4 core machine to an 8 core one. And so they did, one of the machines moved from E16-4as-v4 to E16-8as-v4; 8 vcpus and 128 GB memory.
I tried the query again and:
SQL Server Execution Times:
CPU time = 12514 ms, elapsed time = 1970 ms.
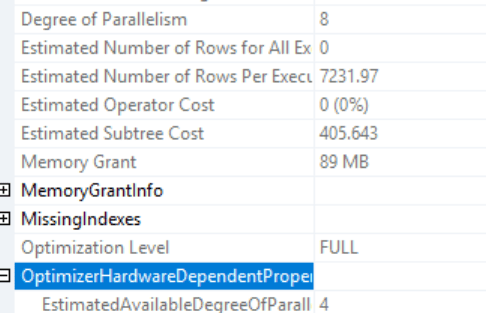
Well, that’s more like it! The plan resembles the 2016 environment and the information is more as expected:
But, why?
The only thing that bugs me is why. Why did this query stay serial on 4 cores and all of a sudden comes to life when running on 8 cores. Maybe it’s a bug in this specific Azure VM SKU? Maybe moving the VM to another host was enough? It all sounds far fetched. Looking at wait stats, I saw a serious amount of Threadpool waits:
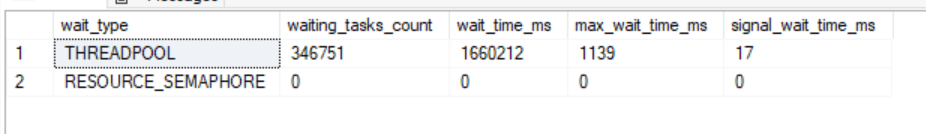
There seems to be enough memory (resource_semaphore) but a shortage of worker threads. I think these are very much related.
The Azure VM in old configuration had these resources:
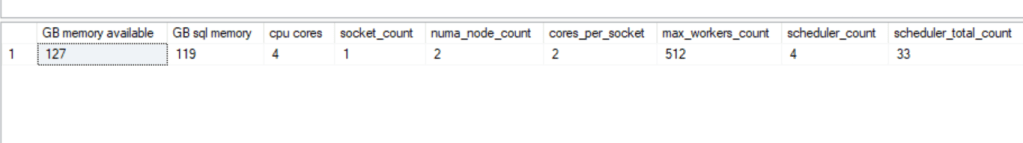
- 127 GB memory available
- 119 GB sql memory
- 4 CPU cores
- 1 Socket
- 2 Numa Nodes
- 2 cores per socket
- 512 as max workers count
- 4 schedulers
The Azure VM in new configuration has these resources:
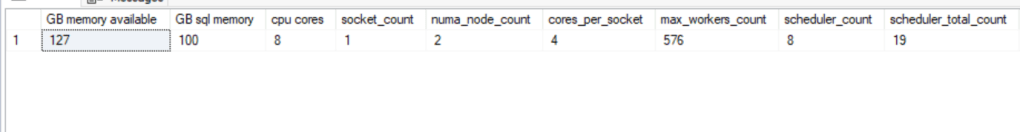
- 127 GB memory available
- 100 GB SQL memory (the supplier configuring the instances missed a best practice somewhere I think)
- 8 CPU cores
- 1 Socket
- 2 Numa nodes
- 4 cores per socket
- 576 as max workers count
- 8 schedulers
So?
Yeah, I don’t really know. Adding more power fixed the problem but I’m not sure why. If you read this and do know why, please let me know. I’m all for learning.
And it was really nice to get reacquainted with my first Microsoft love and I did miss poking around in the DMV’s to see what’s happening.
Thanks for reading!

The estimated DOP on the Azure box (2 as opposed to the expected 4) is probably because it does not want to run the query across two NUMA nodes, and each node only has two cores. Not sure if SQL Server does this automatically, or if you may have configured a maxdop (either on the instance or in a database-scoped setting?).
The different plans could perhaps also be a result of skewed statistics. The spill warning on the aggregate would support this. I’m thinking that the WHERE clause with the GETDATE() lends itself to some unintentional parameter sniffing, since the date could change from the time of the query compilation until execution time. Did you try applying an OPTIMIZE FOR on the date column?
This may not be a popular opinion among my peers, but for reporting queries that are always expected to run for several seconds or even minutes, there’s really no downside to just adding a RECOMPILE.
I realize that you probably can’t change the query, since it’s generated by the reporting tool, but if you really want to kick things around,
OPTION(USE HINT(‘ENABLE_PARALLEL_PLAN_PREFERENCE’))
Just don’t put it in prod. 😉
LikeLiked by 1 person
Thanks for the input Daniel!
MaxDop 0,2 or 8 made no difference. The plan remained serial, even with the max dop query hint.
Funny thing is, the plans changed completely after changing the server from 4 to 8 cores. That’s all that changed. At least, all I could detect. As there’s another party involved in the deployment, they might have changed a Windows setting somewhere that I don’t know about. From a SQL Server point of view, it just got more cores and changed the way it processed data. And that’s something that doesn’t sit well with me at the moment. Identical servers behaving identically is something I like but a four core machine should run things in parallel if there’s basically nothing that’s holding it back.
LikeLike
Yeah, maxdop will only set the cap on dop, not actually make the query go parallel.
I still think it’s somehow numa-related: with 8 cores and two numa nodes, you can run 4 threads on the same core. With four cores on two nodes, you’re down to dop 2, which was what you were seeing.
I’d be curious to see if SQL Server being NUMA aware also means it would automatically do this, even if maxdop was set to 0.
¯\_(ツ)_/¯
LikeLiked by 1 person
SQL Server moves in mysterious ways. Claudío Silva sent me an email asking to check out your OPTION(USE HINT(‘ENABLE_PARALLEL_PLAN_PREFERENCE’)) suggestion.
And guess what, the query went parallel on the 4 core machine and finished in around 3 seconds.
So for some reason SQL thinks a serial plan is better.
I checked the query cost for both plans:
194.643 for parallel
184.184 for serial
For some reason the difference is big enough to let a user wait for a minute or thereabout instead of 3 seconds…
LikeLike
Hahaha!
LikeLiked by 1 person
Let’s the other side as well.
The on-premises machine has a cost of 440.586 for a MAXDOP = 1 plan and 393.474 for the parallel plan.
So for some reason the cost calculation goes a bit off with less cores available within a Numa Node or when it assumes it has to cross Numa Nodes it increases the cost. Does this make sense or has it been a very long day… 😀
LikeLike
Love a good mystery! 🙂
The costing might be different from 2016 to whatever version you’re on in the cloud? Cross numa would make it expensive, but would the costing consider that, rather than just avoid it?
LikeLike
Me too! With 8 cores on Azure, the plan goes parallel and over all 8 cores (in my opinion crossing the Numa boundary).
The new VM has a cost of 405.643 for the parallel plan and when forced serial 449.185. So the costs differ between machines but that is expected. They have different maintenance, other statistics updates that can all affect the cost calculation.
It’s almost as if the optimizer knows running a query on 4 cores on 2 numa’s will be hopeless and skips thinking about a plan running on 2 cores.
When I run the 4 core machine with the parallel plan preference setting and maxdop 2 to force it on 1 numa node (or at least I hope), it generates the same cost it did when running on all 4 cores.
So it seems to create two costs, one for serial, one for parallel regardless of CPU? At least for maxdop 0, 2 and 4 to max the parallelism.
LikeLiked by 1 person
I also find it a bit weird that there are 2 NUMA nodes on this machine. We deploy a lot of VMs from the Ds (memory/cores ratio 4) and Es (memory/cores ratio 8) series and they all have 1 socket even for 32-cores VMs. The Standard_E16s_v5 VM would give 16 cores and 128G for about the same price as E16-4as-v4 in Azure West Europe. And it has only 1 socket. Our SQL Servers all have only 1 NUMA node and we have servers ranging between 4 cores and 32 cores.
I have seen a few examples where multiple NUMA nodes configurations or low vcores per vsocket would give weird/bad behavior. There is of course the infamous 1 core/socket configuration where you hit the 4 sockets limit in standard edition. But I have seen a 16-cores VM with enterprise showing what could be called psychotic behavior in SQL Server. I also don’t understand the problem fully but I always see the best results when sticking to the rule to set the number of cores per socket as high as possible without exceeding the number of physical cores. Essentially minimizing the number of sockets. You can not manipulate this in Azure VMs but maybe you could for the same money even see higher parallelism in Standard_E16s_v5 because of the 16 cores.
Was there a specific reason to choose for the E16-nas-v4 series?
LikeLike
I was really surprised as well to see the two numa nodes. There’s no way (as far as I know) to change the number of cores per node. The server deployment is handled by a different supplier; I can advise them but they make the final call.
LikeLike
Hi Reitse, thanks for sharing the execution plans.
I can explain why it is not going parallel on Azure VM, that’s because the cost of the parallel plan (194.643) is bigger than the serial plan (184.184) so the engine sticks with the non-parallel. (and that’s also why we don’t even have a “NonParallelPlanReason” on the XML)
On your second question, why did it go parallel with more CPUs, the answer relies on Paul’s White statement in his wonderful blog post (Forcing a Parallel Query Execution Plan (sql.kiwi)- https://www.sql.kiwi/2011/12/forcing-a-parallel-query-execution-plan.html)
Paul says:
When SQL Server costs a parallel plan, it generally reduces the CPU cost for a parallel iterator by a factor equal to the expected runtime DOP (degree of parallelism).
also says:
One other point worth mentioning again here is that the DOP estimate is limited to the number of logical processors that SQL Server sees, divided by two.
This explains (1) why you only see the estimated degree of parallelism 2. (NOTE: Check that on your on-premises plan you get Estimated Degree Of Parallelism 4 and then Degree Of Parallelism 8) and (2) by increasing the number of cores on the Azure VM, you got your calculations based on 4 (like on-premises) instead of 2 and that, in this case, is enough to lower the total cost of the parallel plan compared with the serial and the engine will pick it.
I can’t post pictures here, but if you check the example from Paul White you will be able to transpose it to your scenario.
I recommend reading that blog post from Paul White – it is full of goodies!
LikeLiked by 1 person