
This week, i’,m working for a client and one of their requests was to show the duration of a SQL Agent job. The needed the data in a graph. If a job starts to increase in runtime, they want to see it.
This didn’t sound to complicated, you can get the data from the msdb.dbo.sysjobs and msdb.dbo.sysjobhistory tables. To get the data, with a moving average, i’m using this query:
SELECT distinct  server,
		sj.name AS [Job naam],
		convert(date, cast(sh.run_date as varchar(8)), 101) as run_date,
		STUFF(STUFF(RIGHT(REPLICATE('0', 6) +  CAST(sh.run_time as varchar(6)), 6), 3, 0, ':'), 6, 0, ':') 'run_time',
		STUFF(STUFF(STUFF(RIGHT(REPLICATE('0', 8) + CAST(sh.run_duration as varchar(8)), 8), 3, 0, ':'), 6, 0, ':'), 9, 0, ':') 'run_duration (DD:HH:MM:SS)  ',
		sh.run_duration,
		STUFF(STUFF(STUFF(RIGHT(REPLICATE('0', 8) + CAST(AVG(cast(sh.run_duration as bigint)) OVER (
			PARTITION BY name order by run_date ASC, run_time ASC ROWS BETWEEN UNBOUNDED PRECEDING AND CURRENT ROW)as varchar(8)), 8), 3, 0, ':'), 6, 0, ':'), 9, 0, ':') AS MOVING_AVERAGE,
			AVG(cast(sh.run_duration as bigint)) OVER (
			PARTITION BY name order by run_date ASC, run_time ASC ROWS BETWEEN UNBOUNDED PRECEDING AND CURRENT ROW) as MV_AVERAGE
FROM msdb.dbo.sysjobs sj
JOIN msdb.dbo.sysjobhistory sh
ON sj.job_id = sh.job_id
where name not like 'AX_%'
and name not like 'syspolicy_purge%'
--order by run_date ASC, run_time ASC
But then i hit something weird. I was missing data! More specifically, some jobs got a lot of data but others didn’t. It took a few minutes of figuring things out, but it turned out that the SQL Agent has a default history limit.
If you right-click on the SQL Server Agent and go into the properties, you’ll see a menu with a history tab.
This is the default setting:
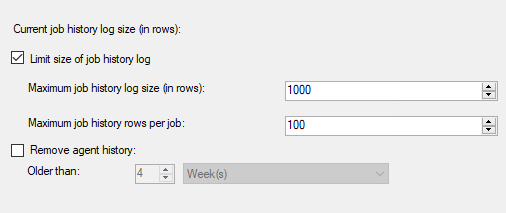
If you’ve got jobs like CDC that run often, you run out of rows really really fast. What i did is this:
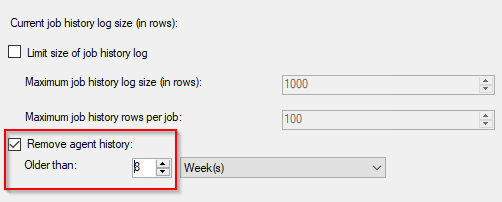
I’m saving the history for a duration of 8 weeks. This way i can show a good graph to the client and at the same time (hopefully) prevent a huge log.
Thanks for reading!
