In one of the projects I’m working in, we needed to have some sort of monitoring solution on SQL Server, but there wasn’t budget for a commercial monitoring solution. There’s a small number of freeware, open-source solutions but these are all difficult to get working. In this blog I’ll show you what Zabbix has on offer as a default and what you can add yourself.
Zabbix
Zabbix is a free monitoring tooling that’s mainly used to monitor your regular infrastructure. Things like servers, switches, routers, workstations etc. It’s really good in doing that and not all that hard to set up. The Zabbix site has good documentation on how to set-up monitoring. But be sure to check out this blog to get everything up and running. I’m using a MySQL database as underlying DBMS and the Zabbix documentation lacks a bit on telling you how to install and configure this.
I’m running Zabbix in Azure on an Ubuntu 18.04 LTS server. That’s a free version of Linux you can install in Azure. You do need to pay for the server itself though. In our setup, you can’t reach any server from the internet other than through the Azure Bastion service. To make things more secure, you can only login with an SSH certificate that is stored in Azure Key Vault. Zabbix can run on a number of Linux distributions, which is the reason i won’t go into installation details. There’s enough about that online.
Why Zabbix?
As i told you in the introduction, we were looking for a free monitoring solution. First i tried the TICK stack (Telegraf, InfluxDB, Chronograph with Grafana front-end), but i couldn’t get it to work. It should work with Azure SQL databases though. I’ve tried to figure out what went wrong and it looks like the database connections fail and/or Telegraf is using query’s that don’t work for some reason. Most likely reason is the database security getting in the way. If you want more information on the TICK stack, Gianluca Sartori has an excellent session on monitoring with the TICK stack.
For some of the basic metrics, I’m running scripts to log disk latency, wait statistics and the WhoIsActive results. But to get these results, i need a VM running 24/7 to run these scripts through the task scheduler. Yes, there are way better solutions like elastic jobs but:
Security
The project is working with very sensitive data. This means all the security measures we can take, have been taken. One of these is to disallow Azure services access to the database. Because if we do, any service in Azure can connect to our database. Whether it’s in our subscription or not.
Think about it. If you log into your subscription, you’re able to get to my database that in the best case is protected with a username and password. Because the database administrator account is just that. No MFA, you can’t disable it. So, we disabled all the azure services to access the database. On the plus side, you can’t connect to my database anymore. On the down side this means that the Elastic Jobs solution doesn’t work. Azure Automation can’t reach the database any more. You can only reach the database through the native client or ODBC/JDBC drivers.
So, by running a VM with Zabbix within the virtual network where the database lives, I can reach the database to do some monitoring.
Configuration
When you’ve installed Zabbix, you can choose to start database monitoring through ODBC. Don’t be like me and create the ODBC connection on the server/workstation you’re using Zabbix on. Because that doesn’t help. You need to install the ODBC drivers on your Linux server. The documentation, in my opinion, isn’t exactly clear on what you have to do. This because the documentation focuses mainly on Redhat distributions and I’m working with Ubuntu. In the end, it’s quite easy. There’s one page on Microsoft docs that tells you what to install. On Ubuntu, there’s nothing else you have to do. On other distributions there seem to be extra steps, but after following the installation steps, the ODBC was installed and working.
ODBC
After that, you configure the ODBC and done. To configure the ODBC, I used this link. Make sure you make a note of the name of the ODBC driver, because that name is needed in your odbc.ini file.
If you’re monitoring an Azure instance and your instance contains both serverless and provisioned databases you can add the database-name to the odbc.ini file. This way you’ll get the results of that specific database. This is especially handy if you need the performance statistics of the database because the default measures the performance of the master database. And usually, that’s not the most important database in your environment when it comes to performance-monitoring. And, on Azure databases don’t share their resources, I can use all the resources for database 1 in my ‘instance’, whilst database 2 still keeps all of it’s own resources available. The databases in an elastic pool are somewhat of an exemption of this rule by the way.
Zabbix host configuration
If you want to start monitoring, the first thing you have to do is add your instance as a host in Zabbix with the FQDN (Servername\instancename for your on-premises database or databasename.database.windows.net for Azure). Then you add the MSSQL by ODBC template to the host (you can find that template under templates\databases). To finish off this part, make sure you fill out the DSN (the name you used in the odbc.ini), the username and password. If everything has been done correctly you can see the data coming in. You can either check at the host configuration and look if items are unsupported (this usually means something is going wrong) or under the monitoring tab at the latest data. Items will show up when they get data. Not all items will get data because the Zabbix template expects a SQL Server instance, not an Azure SQL DB.
Database scaling
One thing to keep in the back of your mind is that when you’re scaling up or down, the underlying object name of your instance will change. To catch these changes and make sure your data keeps refreshing you have to change the default code that gets the performance counters. Why does this matter? Well, Zabbix uses the object name of your instance to get the results in order to present you data that belongs to that specific database. The moment the name changes, Zabbix will miss the information and your monitoring breaks. You don’t want that. During testing I found out that the name isn’t even a name but some sort of hexadecimal value.
If you expect much scaling and you want to keep your monitoring alive, you can change the default template. Go to the template configuration of the MSSQL by ODBC and look for the MSSQL: get performance counters item. This items contains a master query that returns a lot of rows and information. The first query:
SELECT object_name,
      counter_name,
      instance_name,
      cntr_value
FROM sys.dm_os_performance_counters
This will return the object name in the first column but, as I said, this changes during when there’s been a scaling operation. To tackle this, I’ve changed this query to the one you’ll see below.
SELECT concat(substring(object_name,0,7),'Azure',
       substring(object_name,charindex(':',object_name,0),50)) as object_name,
       counter_name,instance_name,
       cntr_value
FROM sys.dm_os_performance_counters
I’m changing the value from the object name to a default, in my case being Azure. This returns a steady result. The part after the colon needs to be kept intact, that’s where the name of the counter resides.
In my configuration per instance I can set-up the macros to look for the Azure instance:
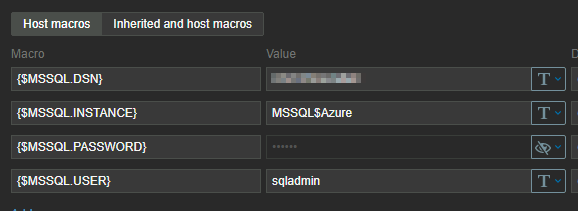
This first query is followed by a number of other query’s that will grab a lot of other information that might or might not be useful, depending on your situation. But those query’s will run nicely on your system and return data.
Data
After all this configuration, what do you get. Well… Some interesting stuff but not exactly what I’d expect. Zabbix will alert me for instance that there are more full scans compared to index seeks. That’s nice, but in an ETL environment that is somewhat expected. In many cases an ETL process reads the entire table to load data. I’m getting the number of logins and logouts, errors and locks. All interesting metrics but the really serious stuff is missing. There’s no disk latency, no wait statistics and no alert if the instance is dying of thread starvation. So I added those myself.
Wait statistics
One of the most important measures in my daily work are the wait statistics. But the default Zabbix monitoring doesn’t really measure those, and certainly not in the 5 minute granularity I’m used to. This is debatable off course but with 5 minutes I can see where an ETL query is going wrong. If you’ve ever worked with ETL processes, you’ll recognize that query’s can do crazy things and it’s nice to be able to zoom in as far as possible to identify issues.
In any case, I want those statistics. But how do you get those. Well, you went to the right blog, because I’m going to show you how I did this.
Get all the data
The first step is to get all the wait statistics to Zabbix. To do that, I’ve created an item that collects all the wait statistics with their respective wait times. The output is a JSON string that can be re-used in Zabbix.
Step two is to get the data you want. In other words, I’ve created so-called dependent items that go into the JSON string to look for one specific wait type and collect the wait time that belongs to that wait type. Not much magic there. But wait, we don’t want the total amount of wait time, because that counter is ever increasing and what I want to see is if one type of wait was dominant in a certain time-frame. So we need the deltas.
I tried to build a query that does just that on the instance and passes the result back to Zabbix. But what happens is that for some weird reason, there’s no result. It looks like Zabbix fires off the query, kills the connection even though there’s a WAITFOR DELAY command and checks if there are results after the given delay. This might have something to do with the ODBC driver but I didn’t want to dive deep into that rabbit hole. Solution is to query the wait stats in full. Just get the current wait stats and pass them over to Zabbix.
What i did next was create calculated items based on the dependent items. I’m taking the last value and take away the previous value. As the values are updated every 5 minutes, this will give me the frame I’m looking for. This way works. Until there’s a scaling event. When the database scales up or down, there’s a failover happening. And with that failover most DMV’s get reset to 0. You will see that happening in your graphs, all values fall back to 0 and start to repopulate again.
Show the data
After creating al these items, you want them to be visualised. Because that’s what Zabbix can do for you, create nice graphs to show the measurements. To do this, I created graphs for the most important wait stats and added those graphs to dashboards. I’ve based the grouping on Enrico van der Laar’s excellent book on wait statistics. Again, every choice is arguable but as a baseline, this feels fine.
Code to add specific waits
In my basic setup, I’ve chosen the (about) 100 waits that had the highest wait times on the instance. But your mileage may (and will) vary. At some point, a weird wait type might show up that’s not (yet) in your monitoring. Maybe you’ve read my blog about a weird Hyperscale DB wait that indicates massive deprecated database performance. You shouldn’t run into that one, but if you do…
Anyway, to add waits into Zabbix you can click away in the GUI and if that’s your style, go for it. But I don’t like to do that more than once. So, I’ve created a query that will return the XML you can copy and paste into the template file. This will allow you to easily add items to your Zabbix environment without too much clicking.
select cast('<item>' + char(13) + '<name> WaitStats: ' + wait_type + '</name>' + char(13) +
'<type>DEPENDENT</type>' + char(13) +
'<key>waitstats.' + wait_type + '</key>' + char(13) +
'<delay>0</delay>' + char(13) +
'<history>1d</history>' + char(13) +
'<units>ms</units>' + char(13) +
'<applications>' + char(13) + char(9) +
'<application>' + char(13) + char(9) + char(9) +
'<name>Wait Statistics</name>' + char(13) + char(9) +
'</application>' + char(13) +
'</applications>' + char(13) +
'<preprocessing>' +char(13) + char(9) +
'<step>' + char(13) + char(9) + char(9) +
'<type>JSONPATH</type>' + char(13) + char(9) + char(9) +
'<parameters>' + char(13) + char(9) + char(9) +char(9) +
'<parameter>$[?(@.wait_type==''' + wait_type + ''')].wait_time_ms.first()</parameter>' + char(13) + char(9) + char(9) +
'</parameters>' + char(13) + char(9) + char(9) +
'</step>' +char(13) + char(9) +
'<step>' + char(13) + char(9) + char(9) +
'<type>CHANGE_PER_SECOND</type>' + char(13) + char(9) + char(9) +
'<parameters>' + char(13) + char(9) + char(9) +char(9) +
'<parameter/>' + char(13) + char(9) + char(9) +
'</parameters>' + char(13) + char(9) + char(9) +
'</step>' +char(13) + char(9) +
'</preprocessing>' +char(13) +
'<master_item>' + char(13) + char(9) +
'<key>db.odbc.get[get_wait_stats,"{$MSSQL.DSN}"]</key>' +char(13) +
'</master_item>' + char(13) +
'</item>' as xml) as [dependent item],
cast('<item>' + char(13) +
'<name>WaitStats: Running ' + wait_type + '</name>' + char(13) +
'<type>CALCULATED</type>'+ char(13) +
'<key>waitstats.running.' + wait_type + '</key>'+ char(13) +
'<delay>5m</delay>' + char(13) +
'<history>7d</history>' +char(13) +
'<units>ms</units>' +char(13) +
'<params>(last(waitstats.' + wait_type + ') - prev(waitstats.'+ wait_type + '))</params>' + char(13) +
'<applications>' + char(13) + char(9) +
'<application>' + char(13) + char(9) + char(9) +
'<name>Wait Statistics</name>' + char(13) + char(9) +
'</application>' + char(13) +
'</applications>' + char(13) +
'</item>' as xml) as [calculated item]
from sys.dm_os_wait_stats
where wait_type like 'LCK%'
This query will return two XML formatted columns with the wait statistic you’ve filtered out in the where clause and the accompanying calculated item you can use in your dashboard. You can import this code into Zabbix and the items will be available to you.
Azure Database Performance
The most important part here is the memory and CPU usage. You can see it in the Azure portal but it’s a bit of a fiddle to get the information. You need to enable all the metrics. This writes data to a storage account or log analytics. From there, you can use Kusto Query’s to retrieve the data you need and add some visualisation. It’s really cool that it’s built into the portal, but when we’re using Zabbix, why not integrate the values there.
Default, the Zabbix template doesn’t return usable values for the CPU and Memory metrics, purely because the default template is aimed at an on-premises installation. And in a regular SQL Server instance, you can monitor usage through DMV’s or you look at the server performance. If you want the Azure performance, you need to get the values from the sys.dm_db_resource_stats DMV. This DMV is populated every 15 seconds but has a short memory. Only the last hour or so is being kept. To get more history, I’m registering the latest value every 15 seconds. This way I can create my own graph, history etc. within Zabbix.
Processor and memory usage query’s
select top 1 avg_instance_cpu_percent
from sys.dm_db_resource_stats
order by end_time desc
select top 1 avg_cpu_percent
from sys.dm_db_resource_stats
order by end_time desc
select top 1 avg_memory_usage_percent
from sys.dm_db_resource_stats
order by end_time desc
select top 1 avg_instance_memory_percent
from sys.dm_db_resource_stats
order by end_time desc
select top 1 cpu_limit
from sys.dm_db_resource_stats
order by end_time desc
 select top 1 avg_data_io_percent
from sys.dm_db_resource_stats
order by end_time desc
select top 1 avg_log_write_percent
from sys.dm_db_resource_stats
order by end_time desc
All these scripts are contained in their own items with both history and trends. There are accompanying graphs that can be used in dashboards to create a complete overview of your instance.
What does the end result look like I can hear you asking. Because there’s been a lot of text, some iffy code and no images!

This dashboard shows my CPU usage on a Hyperscale database that has seen some scaling in the last days. You can see that the wait stats kind of break because of those scaling actions, but overall you can see the waits nicely aggregated with min and max values and the time that they occurred. The real worth of this screen comes when either users complain about the database or when optimizing query’s from last night. If you can see the most active waits, you get some indication of where the pain lies.
Off course, you’ll need the query and the execution plan, and for that we have both the sp_WhoIsActive logging and the Query Store. The latter is always enabled on Azure.
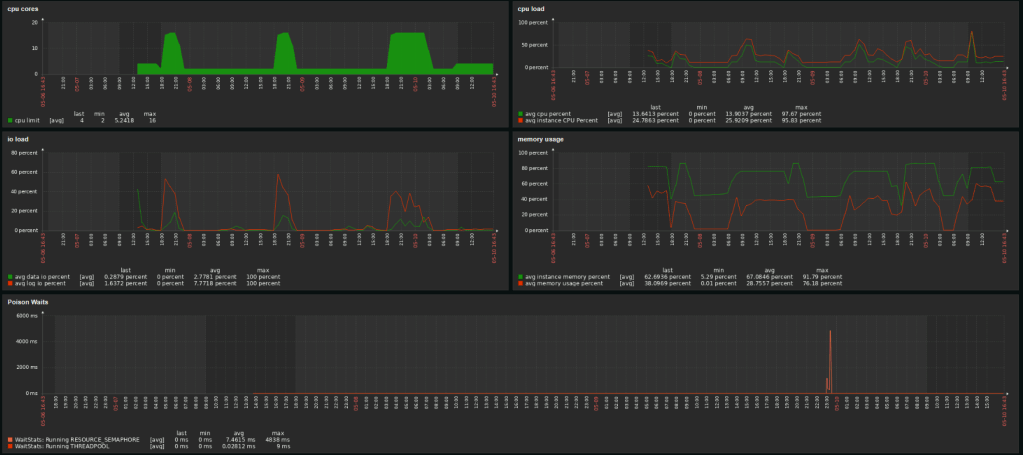
This dashboard will provide you with a more general overview of the database. The number of cores, the CPU load of both database and instance, the IO load and the memory usage. Keen viewers will see a drop in memory usage when the database scales. Well spotted! When a database scales (up or down) it will free up the bufferpool. Something I wasn’t hoping to see is one of the poison waits: Resource_Semaphore. The instance ran out of memory. Not good and something that needs some extra investigation. In any case, I need to add an alert for that.
Missing data
Something that might occur is that your query or monitoring job doesn’t return data. This is bad for a number of reasons.
First, if you miss data, something is wrong, but you won’t be alerted.
Second, if you miss data, your history graphs will break and might miss essential values for either trend analysis or post-mortem on major production issues
There’s always a reason things break. There’s no thing as bit fatigue (compared to metal fatigue). If your process breaks, something must have changed. The sooner you’ve picked up on that, the quicker mitigation can start. But again, no data isn’t something Zabbix alerts on by default. You will have to build your own triggers to fire. Zabbix has a built-in function called nodata. You can call this function in your trigger to fire when your object hasn’t returned data for x amount of time or x runs or whatever you like to configure. You can find the documentation on the Zabbix site. To prevent me from showing out-of-date-code, I’m not going to.
One thing to remember is that the minimum threshold for no data is 30 seconds.
Monitoring jobs
Now that you’ve got a Linux VM running and you’re monitoring with Zabbix, why not use the machine for your monitoring jobs that just won’t fit into Zabbix. For instance, registering detailed wait statistics, who is active results etc.
To do that, you’ll have to jump through three hoops.
First one is to install the mssql-cli binary. There are enough sources online that will help you with that. If you want details on what this can do, check here.
Second one is to create the bash files and sql files that you need. The bash files contain the syntax you’re familiar with from the SQLCMD on Windows. I’m using sql files because it’s easier to load a long query from a file than to add it to the commandline. If you’re using passwords with special characters, put double quotes around the password. This will make sure a closing bracket, dollar sign or otherwise special character messes up your connection string.
Finally you need to schedule the commands in crontab, the linux task scheduler.

In my case, it looks like this. The whoisactive runs every minute, the waitstats every 5 minutes, the statsmaintenance every day at 8, the index maintenance every sunday at 12 and the clustered columnstore maintenance every day at 7. Remember, if you’re on an Azure machine and don’t change the region, your VM will run in UTC time. To check your crontab schedule, you can use the guru site.
If you’ve read this far into my blog, you’ll wonder why I’m registering wait stats both on the database and in Zabbix. The answer is that I can add the signal wait time and waiting tasks easily on the database whereas adding those into Zabbix is a lot of extra work. It will put a lot of extra load on the Zabbix machine and, for now, I’m only interested in the wait times. When I need to dig deeper into the results, I’ll log on to the database and start working there.
This entire blog is meant as a starting point in monitoring your SQL environment with Zabbix. If I’m honest, it’s no match from the commercially available tooling. You know the vendors ;). But if you’re a small company and those tools take too much of your IT budget, this could be worth exploring. Because it’s all open source, there are plenty of people willing to help you out when things go awry. And when you dig into some nooks and cranny’s of the tool, you’ll be able to figure out how to get it to work for your specific use case.
Thank you so much for reading this entire blog and making it to the end. I know it’s a long one and not too easy on the eyes. But I sincerely hope you’ve learned some things on the way. If you ever use something from here I’d love to hear it.
If you have questions, drop them below or ask me on Twitter.

Hi,
very helpfull, so in wait stats calculate, zabbix doesn’t support prev function,
do you have a workaround, this is for on-premises instance
LikeLike
Hi Eric, I think it depends on the version of Zabbix. The template was built for version 5 and I’ve heard that upgrading to a higher version requires some code refactoring. It looks like the prev function has been replaced with last:
(last(//mssql.average_wait_time_raw) – last(//mssql.average_wait_time_raw,#2))
Even less funny, it seems the XML datatype has been replaced with Yaml. As the monitoring project has since been passed on to other coworkers, I’m no longer involved in keeping the code up to date but let me know if you run into anything 🙂
LikeLike