

My previous post on load testing Azure SQL covered the Business Critical tier; let’s move to the one that is getting a lot of attention lately: Hyperscale. And no, you’re not the only one with Scooter’s Hyper Hyper song playing in the back of your mind.
Before we get into the tests, I need a moment to explain a few things about this tier. No, it’s not as complicated as the DTU models, but there are a few things to keep in mind.
First, when you create a Hyperscale database, it creates a 10 GB storage baseline. All other tiers will either include storage, offer it at a fixed price, or let it grow with you. This one already starts differently. The good thing is, you can go up to 128 TB. Yes, Terabyte. That is a significant amount of data. If, like me, you wonder why this limit exists, it’s because performance will suffer above that due to the underlying architecture. The resources that make up Hyperscale can’t keep up with more data than this.
The Hyperscale architecture
Before moving on to the offerings and measurements, I want to try to explain how Hyperscale works. It is complicated, and I might try to do a deep dive in a different blog post.
Let’s start at the storage layer, where data is stored in both files and snapshots. The data is stored across different Azure storage accounts to ensure you can do zone and region failovers. The snapshots are file snapshots that support database recovery and restores. These are almost instantaneous, removing the BACKUP_IO wait type.
The data is written and read through so-called page servers. These page servers have local SSD storage and provide the connection to your data. Each page server can hold up to 128 GB of data. The local SSD storage is like your local memory; hot pages stay in cache. The data itself doesn’t live on the page server; it lives on the storage layer below.
When you read data, you connect to the cluster of page servers that will return the data for you. When you write (insert, update, delete) data, you work through a log service that handles these operations for you. This service not only interacts with the data on the page server the data is served from, but it also does this with the replicas (you can have named replicas and High Availability replicas. Because all write traffic goes through the log service, it makes sense that you can see Log waits when there’s a lot of write traffic.
If your workload has specific read-write requirements that can be separated from read-only requirements (think ETL processes versus Reporting), you could think about using a replica. In these scenarios, the data reading will be routed to the read-only replica (make sure the application intent is set to read-only), making sure your reads don’t get in the way of the writes.
Now, the above is a simplification of everything happening under the hood on Hyperscale, but it should give you insight into the difference between this Tier and the others. The architectural differences also explain why you can’t easily migrate from Hyperscale to another tier; it’s not a selector in the Azure Portal; there’s more work involved. I don’t think this is bad, just something to keep in mind.
Provisioned and Serverless
Hyperscale offers several options: provisioned and serverless, and serverless now includes auto-pause. The provisioned SKU offers standard, premium, and premium memory-optimised options. So, before you start creating your database, think about what you actually need.
Standard offers up to 128 vCores (hyperthreaded) with a ratio of 5.1 GB of memory per vCore. You will get up to 625 GB.
Premium offers up to 192 vCores (hyperthreaded), with a ratio of 5.2 GB of memory per vCore. You will get up to 832 GB (160 vCores) or 844 GB (192 vCores).
Memory Optimised offers up to 80 vCores (hyperthreaded), with a ratio of 10.2 GB of memory per vCore. You will get up to 816 GB.
One thing to keep in mind is pricing. Because there are differences here. Let’s use the following example: 1 database, 8 cores, 1 HA Replica, 1 Names Replica and 1000 GB of storage.
| SKU | Price per month |
|---|---|
| Standard Series (Gen 5) | 3,363,21 |
| Premium Series | 3.363,21 |
| Premium – Memory Optimised | 4602,28 |
| DC (Confidential Compute) | 7.588,63 |
What boggles me a little is that there’s no price difference between Standard and Premium Series. The differences between Standard and Premium have to do with the number of cores and whether serverless can auto-pause.
Something else to take into account when doing some calculations is this info button:

Yes, you’re essentially getting the software for free; you pay for storage, compute, and disk I/O. But it includes no license fee, which makes it cheaper. On the other hand, if you use Azure Hybrid Benefit, the license fee drops as well, saving you around 55%.
Again, do your homework and run the numbers before you choose.
One thing to keep in mind: Microsoft has a lot going on with its roadmap. If you want to see what’s happening, follow this link: https://aka.ms/sqlroadmap
To make sure you understand the key terms, let me start by explaining them.
Terminology
Tier: the type of database. In Azure, you can choose Standard, Premium, General Purpose, Hyperscale, or Business Critical.
SKU: Stock Keeping Unit. In databases, it’s the number of DTUs or Cores you assign to the database. Database size (GB storage) isn’t part of the SKU, but you can set it separately.
These are the most important terms that keep coming back; let’s move on to the files I’ve used.
The files
I’ve been using a large set of files, and large files within that set. In total, around 500 GB of plain text data. This posed the first problem for the Standard Edition, because the S2 edition has a hard limit on how much data it can hold. This means that the results for this one are somewhat limited. All the other databases I tested could handle the full dataset.
If you want to learn more about the setup, click here!
Just loading files into the database doesn’t help; I need to measure things.
The measurements
The testing consists of two measurements. The first part is timing: how long it takes to load all the data into the database. Because I know the data size, I can get a good measure of that database Tier and SKU’s intake capacity. The second measurement is wait statistics. If you want to know what’s holding up your database, these are your go-to metrics. SQL Server does an excellent job telling you what it’s waiting for.
Another result of these measurements is cost. In the table, I’ll show the compute cost. You also need to pay for storage. I’ll add those costs where possible. To calculate the cost, I chose the West Europe region. If you choose a different region, prices will change.
Now, let’s get into the numbers!
The results.
In my previous posts, I’ve limited myself to a specific Tier and SKU. For Hyperscale, I’ve combined the Standard and Premium ones. Not only because they’re in the same Tier, but also because the results are very interesting to compare.
I’ll start with the Customers files: 9 GB of data.
| Tier-SKU | Duration | MB/s | Cost (Euro) |
| Hyperscale Standard 4 Cores | 0:04 | 39,51 | 0,05 |
| Hyperscale Standard 8 Cores | 0:03 | 52,68 | 0,07 |
| Hyperscale Standard 16 Cores | 0:04 | 39,51 | 0,22 |
| Tier-SKU | Duration | MB/s | Cost (Euro) |
| Hyperscale Premium 4 Cores | 0:03 | 52,68 | 0,03 |
| Hyperscale Premium 8 Cores | 0:03 | 52,68 | 0,07 |
| Hyperscale Premium 16 Cores | 0:03 | 52,68 | 0,14 |
This is a bit boring; it’s either 3 or 4 minutes, and it rushes through the data. The 3 or 4 minutes is more about rounding than making a significant difference. I’d argue that with small files, it doesn’t really matter that much which choice you make. From a cost perspective, there’s not much to win or lose here either.
Moving on to the PartSupp files: 46 GB of data.
| Tier-SKU | Duration | MB/s | Cost (Euro) |
| Hyperscale Standard 4 Cores | 0:12 | 65,56 | 0,25 |
| Hyperscale Standard 8 Cores | 0:13 | 60,52 | 0,35 |
| Hyperscale Standard 16 Cores | 0:15 | 52,45 | 0,70 |
| Tier-SKU | Duration | MB/s | Cost (Euro) |
| Hyperscale Premium 4 Cores | 0:09 | 87,42 | 0,11 |
| Hyperscale Premium 8 Cores | 0:10 | 78,68 | 0,23 |
| Hyperscale Premium 16 Cores | 0:10 | 78,68 | 0,47 |
There are differences now between the SKUs, with premium running faster than standard. Which is as expected. Less expected, though, is that premium is cheaper. Well, as the prices are identical, maybe not that surprising; if you run faster, you’ll be cheaper. You can also see that the speeds are now climbing towards levels you may be used to on-premises. So, speed is going up and cost is going down, just like duration. Cool, I like that.
Let’s move to the big files!
| Tier-SKU | Duration | MB/s | Cost (Euro) |
| Hyperscale Standard 4 Cores | 1:08 | 76,05 | 0,72 |
| Hyperscale Standard 8 Cores | 1:09 | 74,94 | 1,42 |
| Hyperscale Standard 16 Cores | 1:07 | 77,18 | 2,85 |
| Tier-SKU | Duration | MB/s | Cost (Euro) |
| Hyperscale Premium 4 Cores | 0:53 | 97,57 | 1,23 |
| Hyperscale Premium 8 Cores | 0:49 | 105,53 | 1,14 |
| Hyperscale Premium 16 Cores | 0:49 | 105,53 | 2,29 |
Now we’re getting to the big numbers. The Standard seems to limit around 77 to 80 MB/s. The Premium Tier really starts to fly here, maxing out at 105 MB/s in my tests. This is also where I had a few chats with Microsoft; they can get it up to 113 MB/s, but they also told me the difference between my test and theirs isn’t very significant. What you have to keep in mind, for instance, is the use of the Azure platform (networking), the time of day, the speed of the source, and other factors. One bottleneck during testing was the disk where my files live. I found that increasing the IO there had a huge impact on these measurements.
If you look closely at the measurements, you’ll notice something else. With four cores, the standard Hyperscale is cheaper, but in this test with eight and sixteen cores, the Premium SKU is cheaper.
Coming back to the storage part. Just like the general-purpose tier has no free storage, the Premium Tier, Business Critical and Hyperscale also charge you for storage. If you want to store the Customers, you pay about 2,5 euros per month. The PartSupp will cost about 12 euros, and the LineItem will cost about 80 euros per month. If you’ve read my post on Business Critical storage, you may think I forgot to update this part. I didn’t; the storage prices are essentially the same. In a way, this makes choosing the tier easier, as you can skip storage costs and focus on the compute costs. For comparison, regular Azure Storage costs around 7 euros. So yes, SQL Storage is expensive.
As promised, I also recorded the wait statistics. Here are the top waits for both SKUs. Now, unlike the previous blogs, where there was one table for each set of cores, you will now see two. Just because I’ve put Hyperscale General Purpose and Hyperscale Premium together. And I’ll only show the ones that have a significant impact.
HS 4 Cores Waits
| Wait Type | Wait Description | Percentage |
|---|---|---|
| LOG_RATE_GOVERNOR | The transaction log write rate is throttled by the database service tier. | 23,80 |
| PREEMPTIVE_OS_GETQUEUEDCOMPLETIONSTATUS | SQL is letting the OS check on asynchronous IO operations | 11,55 |
| LOGMGR_FLUSH | Waiting for the transaction log manager to flush log records. | 10,27 |
| SQP_STATS_REPORTING | Unknown | 6,1 |
| REMOTE_BLOCK_IO | Waiting for a remote block I/O operation (Hyperscale remote storage path). | 5,92 |
| XE_LIVE_TARGET_TVF | Waiting while reading an Extended Events live target through its table-valued function. | 5,92 |
| RBIO_COMM_RETRY | Waiting to retry communication for remote block I/O. | 5,90 |
| HADR_FABRIC_CALLBACK | Waiting for an Azure SQL high-availability fabric callback. | 5,22 |
| PVS_PREALLOCATE | Waiting for preallocation in the persistent version store. | 5,10 |
| PAGEIOLATCH_SH | Waiting for a data page to be read from storage into memory (shared latch). | 4,98 |
| PREEMPTIVE_XE_DISPATCHER | A SQL worker is waiting in a preemptive Extended Events dispatcher operation. | 3,86 |
| WRITELOG | Waiting for transaction log records to be written to storage. | 2,64 |
What stands out here, in my opinion, is that the waits are mostly due to the underlying system. Yes, there’s log rate throttling because apparently the four-core Hyperscale isn’t allowed to go all out on the logs. The rest seems to be mostly system-related; at least not something we DBA’s can do anything about. Which is good, because the data ingestion code doesn’t need changes, and bad because there’s nothing we can change.
HS Premium 4 Cores Waits
| Wait Type | Wait Description | Percentage |
|---|---|---|
| SOS_WORK_DISPATCHER | An internal SQL worker is waiting for work from the scheduler dispatcher. | 65,49 |
| SOS_SCHEDULER_YIELD | A worker yielded the CPU and is waiting to be scheduled again. | 11,25 |
| LOGMGR_FLUSH | Waiting for the transaction log manager to flush log records. | 3,38 |
| PREEMPTIVE_OS_GETQUEUEDCOMPLETIONSTATUS | SQL is letting the OS check on asynchronous IO operations | 2,77 |
| PREEMPTIVE_XE_DISPATCHER | A SQL worker is waiting in a preemptive Extended Events dispatcher operation. | 2,72 |
What’s happening here? Well, not too much to be honest. The database is working hard to process the data; not much else is happening. The top wait is one you can, according to Paul Randall, safely ignore. Why did I include it? Well, because the rest of the waits are so small that removing this one would give those too much credit. It just feels like the database is waiting for more data to arrive and be processed.
HS 8 Cores Waits
| Wait Type | Wait Description | Percentage |
|---|---|---|
| LOG_RATE_GOVERNOR | The transaction log write rate is throttled by the database service tier. | 38,71 |
| PREEMPTIVE_XE_DISPATCHER | A SQL worker is waiting in a preemptive Extended Events dispatcher operation. | 11,41 |
| PREEMPTIVE_OS_GETQUEUEDCOMPLETIONSTATUS | SQL is letting the OS check on asynchronous IO operations | 8,15 |
| SOS_SCHEDULER_YIELD | A worker yielded the CPU and is waiting to be scheduled again. | 5,03 |
| REMOTE_BLOCK_IO | Conncected to the RBIO waits, probably waiting on a remote write in the Hyperscale architecture | 4,21 |
| RBIO_COMM_RETRY | Resilient Buffer IO; The database is retrying IO operations as somewhere something failed | 4,21 |
HS Premium 8 Cores Waits
| Wait Type | Wait Description | Percentage |
|---|---|---|
| SOS_WORK_DISPATCHER | An internal SQL worker is waiting for work from the scheduler dispatcher. | 71,64 |
| LOG_RATE_GOVERNOR | The transaction log write rate is throttled by the database service tier. | 7,6 |
| PREEMPTIVE_OS_GETQUEUEDCOMPLETIONSTATUS | SQL is letting the OS check on asynchronous IO operations | 2,44 |
| PREEMPTIVE_XE_DISPATCHER | A SQL worker is waiting in a preemptive Extended Events dispatcher operation. | 2,28 |
The first thing that surprises me is that there are very few relevant waits with the Premium SKU. It’s humming along quietly, but not registering many blockers. Yes, the log rate is a little throttled, but that’s about it. The regular one seems to be hit harder by the log rate throttling and seems to have issues writing data (or getting confirmation that the write succeeded).
Since there was very little difference in time between 8 and 16 cores, I’m not expecting large changes between these tiers, but let’s find out!
HS 16 Cores Waits
| Wait Type | Wait Description | Percentage |
|---|---|---|
| LOG_RATE_GOVERNOR | The transaction log write rate is throttled by the database service tier. | 43,20 |
| PREEMPTIVE_OS_GETQUEUEDCOMPLETIONSTATUS | SQL is letting the OS check on asynchronous IO operations | 15,96 |
| PREEMPTIVE_XE_DISPATCHER | A SQL worker is waiting in a preemptive Extended Events dispatcher operation. | 5,74 |
| XE_LIVE_TARGET_TVF | Waiting while reading an Extended Events live target through its table-valued function. | 4,01 |
| REMOTE_BLOCK_IO | Conncected to the RBIO waits, probably waiting on a remote write in the Hyperscale architecture | 3,98 |
| RBIO_COMM_RETRY | Resilient Buffer IO; The database is retrying IO operations as somewhere something failed | 3,98 |
HS Premium 16 Cores Waits
| Wait Type | Wait Description | Percentage |
|---|---|---|
| SOS_WORK_DISPATCHER | An internal SQL worker is waiting for work from the scheduler dispatcher. | 73,20 |
| LOG_RATE_GOVERNOR | The transaction log write rate is throttled by the database service tier. | 8,8 |
| PREEMPTIVE_OS_GETQUEUEDCOMPLETIONSTATUS | SQL is letting the OS check on asynchronous IO operations | 4,2 |
| PREEMPTIVE_XE_DISPATCHER | A SQL worker is waiting in a preemptive Extended Events dispatcher operation. | 2,17 |
The Premium SKU has nigh identical waits and wait times. No changes between 8 and 16 cores. For the general purpose SKU, there are small changes, but nothing that really stands out in my opinion. Well, maybe it’s because, again, there’s been some waiting on checking successful writes.
Apart from the Premium SKU being quicker, it could very well be that the lack of RBIO_COMM_RETRY and REMOTE_BLOCK_IO waits is contributing to the Premium SKU being this much faster. Again, the difference is 77 to 105 MB/s (or an increase of 28 MB/s without added cost).
As always, if you want to know more about wait stats, my go-to explanation is the Paul Randall website.
Totals
So, adding it all up, the 4 cores set me back 1,03 or 1,39 for Premium. 8 cores cost 1,84 or 1,44 for Premium. 16 Cores cost 3,78 or 2,90 for Premium. In this case, it’s very clear that more money offers more performance between the cores, and Premium is cheaper with the 8 and 16 core SKU’s. And I did not expect that!
Remember, these are my own tests; run your own when comparing to ensure the simulated workload matches yours. For instance, these tests didn’t include data processing. That will come later.
Comparison with Standard, Premium, and General Purpose
Let’s round this one up with a comparison between Standard, Premium and General Purpose.
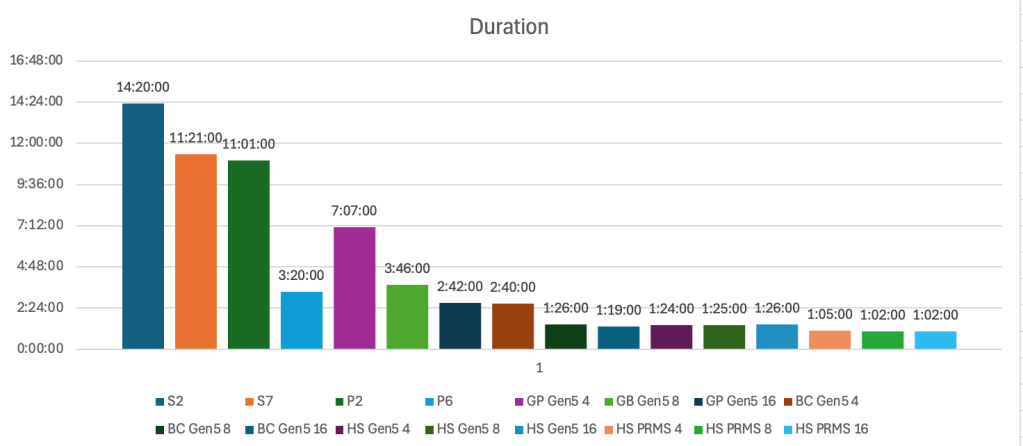
The further right you move in this graph, the more speed you get when processing all the data. And in all cases, the Hyperscale Premium beats them all. Impressive, most impressive!
It won’t surprise you that the speed graphs are also owned by this tier and SKU.
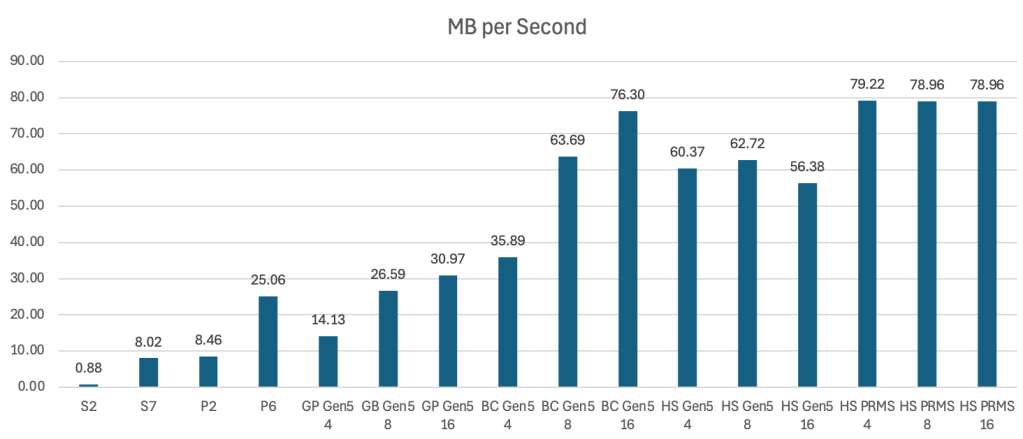
Ha, tricked you! On average (over all loads), the Business Critical tier is able to keep up with the Premium Hyperscale tier.
Let’s look at the cost. I’ve included the storage cost, since it’s something to consider as well. I’ve added the database’s monthly cost and the primary storage. With different tiers, you have several extra options to choose from, each adding to your database cost. To keep me sane, I’ve opted not to include those.
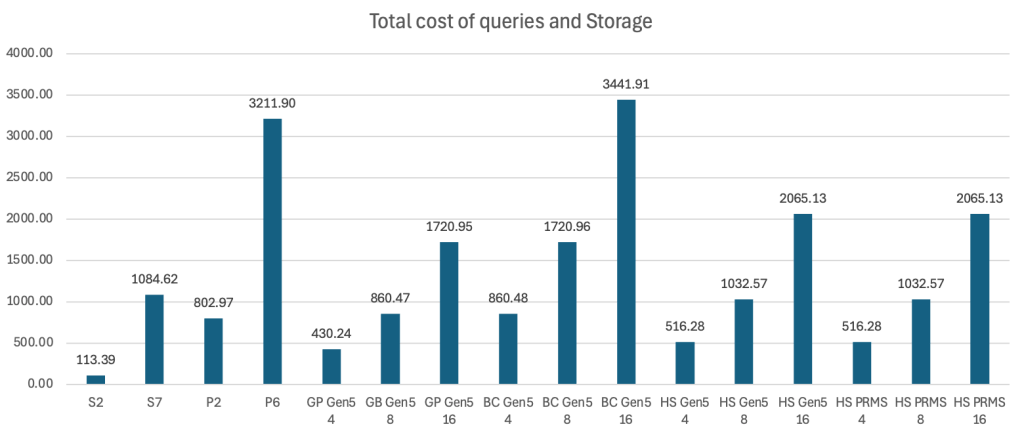
Most of the time I’m talking with customers, they want to know how to get the most excitement for their Euros. When you look at this graph and compare it with the MB/s, even though Business Critical can keep up with Hyperscale, it’s losing the battle on cost. The Hyperscale Tier is 1400 euros cheaper compared to Business Critical. In a client discussion, this would be an easy choice.
In the end, it all comes down to how much you’re willing to pay for performance. And you’ll run a lot more queries than I do to test the database.
Loose ends or what’s next.
There are a few. The first one is two Tiers I haven’t tested: Azure SQL Managed Instance. The reason is that it’s very expensive to test, so I have to find a good time slot to run the tests. The second is the Fabric SQL Database. So far, my testing hasn’t delivered good results, and I don’t think these tests are the best fit for this database.
Finally, I have to retest the data processing capabilities. The S2 won’t take part, as it can’t handle all the data. The others can, and will suffer from my bad stored procedures!

