In my previous blogs, I’ve written about Fabric and all the cool things it can do. Thing is, my load tests were based on files. Either CSV or Delta. But in reality, a lot of data comes from an on-premises database server. In reality, you might connect to a SQL 2008 instance or maybe even older. Truth be told, I haven’t got an instance in that version/edition around anymore. So I had to use SQL Server 2019, a version I’m encountering more often nowadays.
For this blog, it won’t make much sense to create a humongous database and try to get all the data in. Fabric will cope, the major issue (in my experience) is the internet connection between my local database and the Fabric environment. One thing I’m really curious about is if Fabric will have the Link capability that was introduced for Synapse Analytics and SQL Server 2022.
Synapse Link and other sources
To start with a small spoiler, the Synapse Link for SQL Server wasn’t available for Fabric at the time of writing. I can only expect it to be there when Fabric goes GA. Let’s what we do have.
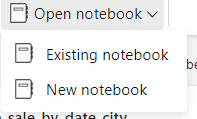
In my Lakehouse I’ve got the options for notebooks, Pipelines, files and shortcuts.
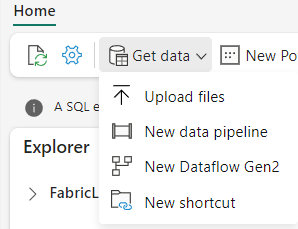
In my Warehouse, I’ve got one option to get data:
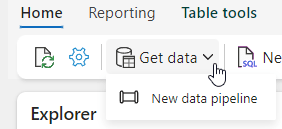
The experience from either side is the same, Click on new and provide a name for the data pipeline. Next step is connect to a data source:

Create the source
I would like to connect to my Self Hosted Integration Runtime (SHIR) for my SQL server. Let’s see wat the SQL Server has to offer.
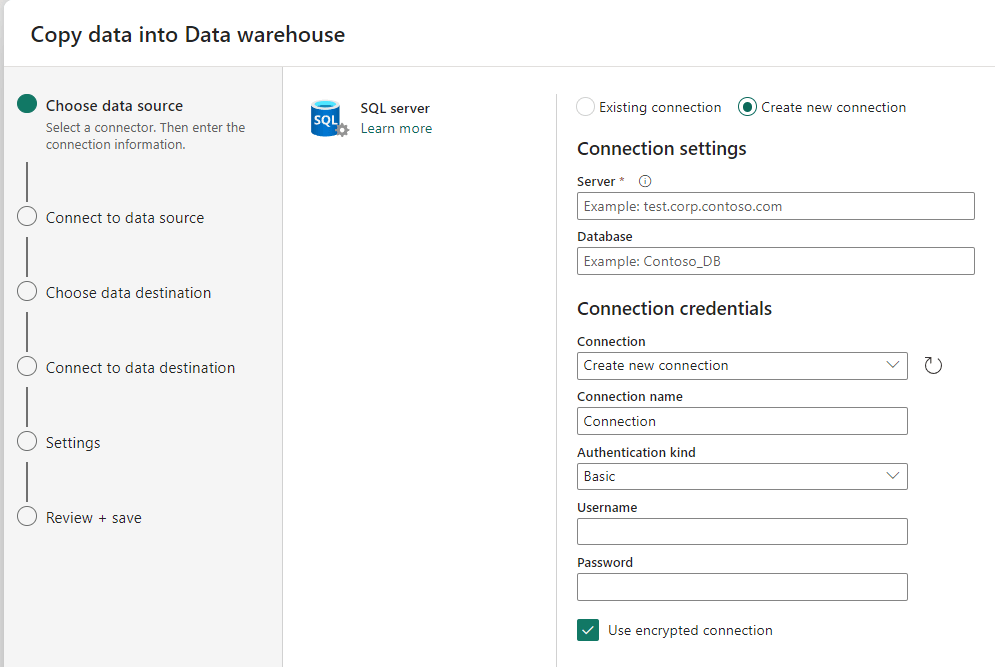
Alas, in the preview, there’s no option to use the SHIR. You can create your own connection to your database if you’re brave enough to share it to the angry internets. Purely for trying it out, I opened up a harmless demo database to the internets but I would never advise you to do this with any real data! Not even your fully anonymised development database. Please just use AdventureWorks, Wide World Importers or some other dataset that has no relevance whatsoever to your company.
If you’re creating the connection, remember to not only use the IP address (or domain name if you’re really fancy), but also the portnumber. Something like 1.2.3.4,1433. In case of a named instance: 1.2.3.4\FabricDemo,1433. Without the portnumber the connection will fail. Remember to check local firewalls as well to allow for incoming requests, especially if you’re using other ports than the default.
Select the tables
If your connection succeeds, you’ll see the next screen:

As I’m in a copy flow with a GUI, it’s not the right place to do some dynamic stuff, so let’s just select all the tables from a database.

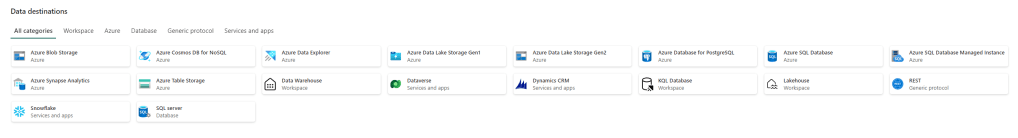
Select the destination
Next up, drop the data:
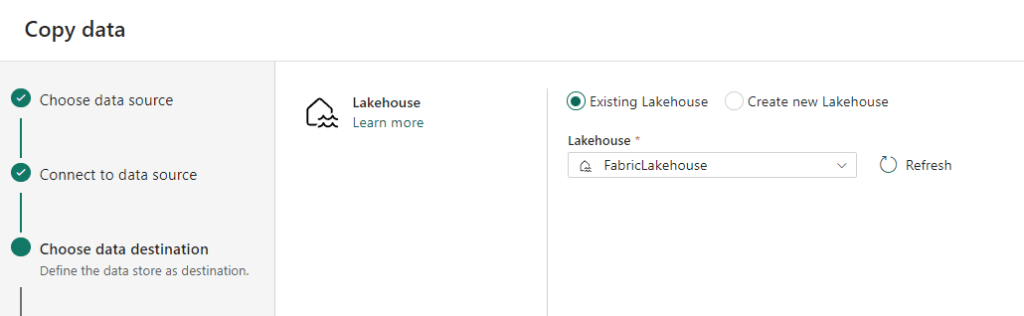
I’m going to write this data in my Lakehouse, just because I can :). I could have loaded the data into my Warehouse if I wanted to.
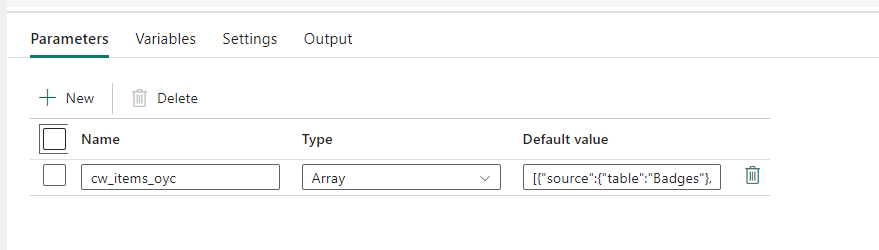
Next step is to name my destination tables. I could go for files as well, but I’d like to see what happens when I’m loading directly to tables. The default name of the table is schemaname_tablename but that way I can quickly lose the source system. So I’m adding SO (StackOverflow) as an extra qualifier to my destination table.
If I had started with a better design in my Lakehouse from the start, I would have used schema names to separate the different sources. In any case, use your preferred way of working.

I’ve used the Append option to allow for updates in my data without dropping and recreating the table.
Summarise and run
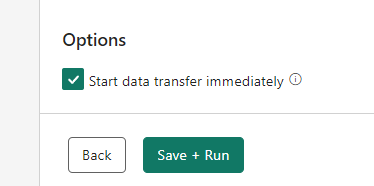
Finally the review (summarised) of what you’ve done and you can start the transfer immediately. It’s an option at the bottom left of your screen. If you’re just building and don’t want the process to run, make sure to uncheck it.
When I hit Save + Run, I got sent back to the main window and got this:

Quite regular Data Factory behavior
A nice foreach loop, created for me. It’s the same principle as Data Factory. A Pipeline variable with the tablenames and for each value in this parameter, get the data.
The output, as we’re used to with Data Factory, is nondescript at high level:

It’s nice they succeed but what are they doing?
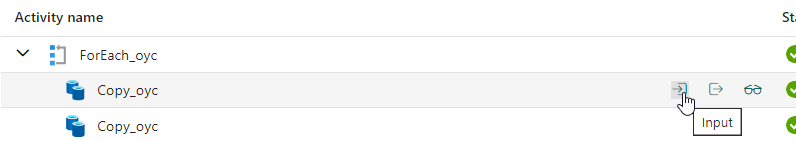
Input details
Take a look at the input, if you click on it, it shows a small window with a lot of information:
{
"source": {
"type": "SqlServerSource",
"partitionOption": "None",
"datasetSettings": {
"type": "SqlServerTable",
"typeProperties": {
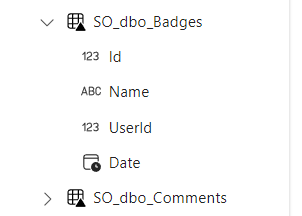
"schema": "dbo",
"table": "Badges"
},
"schema": [],
"externalReferences": {
"connection": "0e86-4ee2-b3e1-e2f03f429787"
},
"annotations": []
}
},
"sink": {
"type": "LakehouseTableSink",
"tableActionOption": "Append",
"datasetSettings": {
"type": "LakehouseTable",
"typeProperties": {
"table": "SO_dbo_Badges"
},
"schema": [],
"linkedService": {
"properties": {
"type": "Lakehouse",
"typeProperties": {
"artifactId": "832d2d26-472a-9028-9d2860e15071",
"workspaceId": "67b89416-5490-9133-3d0cf579aa1f",
"rootFolder": "Tables"
},
"annotations": []
},
"name": "FabricLakehouse"
},
"annotations": []
}
},
"translator": {
"type": "TabularTranslator",
"typeConversion": true,
"typeConversionSettings": {
"allowDataTruncation": true,
"treatBooleanAsNumber": false
}
},
"enableStaging": false
}
Now I can see the source and destination (even though in this code it’s still named sink). This will help me determine what table took the longest to transfer.
Output details
The output has some data as well:
{
	"dataRead": 38387564,
	"dataWritten": 14493202,
	"filesWritten": 1,
	"sourcePeakConnections": 1,
	"sinkPeakConnections": 1,
	"rowsRead": 1102019,
	"rowsCopied": 1102019,
	"copyDuration": 14,
	"throughput": 4265.285,
	"errors": [],
	"usedDataIntegrationUnits": 4,
	"usedParallelCopies": 1,
	"executionDetails": [
		{
			"source": {
				"type": "SqlServer"
			},
			"sink": {
				"type": "Lakehouse"
			},
			"status": "Succeeded",
			"start": "6/29/2023, 8:44:28 AM",
			"duration": 14,
			"usedDataIntegrationUnits": 4,
			"usedParallelCopies": 1,
			"profile": {
				"queue": {
					"status": "Completed",
					"duration": 4
				},
				"transfer": {
					"status": "Completed",
					"duration": 9,
					"details": {
						"readingFromSource": {
							"type": "SqlServer",
							"workingDuration": 0,
							"timeToFirstByte": 0
						},
						"writingToSink": {
							"type": "Lakehouse",
							"workingDuration": 0
						}
					}
				}
			},
			"detailedDurations": {
				"queuingDuration": 4,
				"timeToFirstByte": 0,
				"transferDuration": 9
			}
		}
	],
	"dataConsistencyVerification": {
		"VerificationResult": "NotVerified"
	}
}
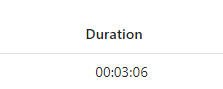
There’s a lot of information there; one thing to note is the duration. It says 4.
As with Data Factory, durations (and with that usage billing) is rounded up. I have yet to see how this might affect the usage of your Fabric capacity though. It’s something that’s still not clear to me.
Back to the Lakehouse
Let’s see what’s happening in my Lakehouse, I told data factory to create tables for me.
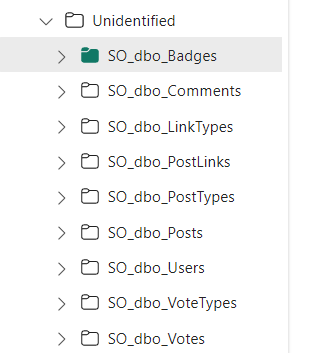
Something is afoot here!

The funny thing is, reload the pane and all of a sudden, the tables are there:
Dataset
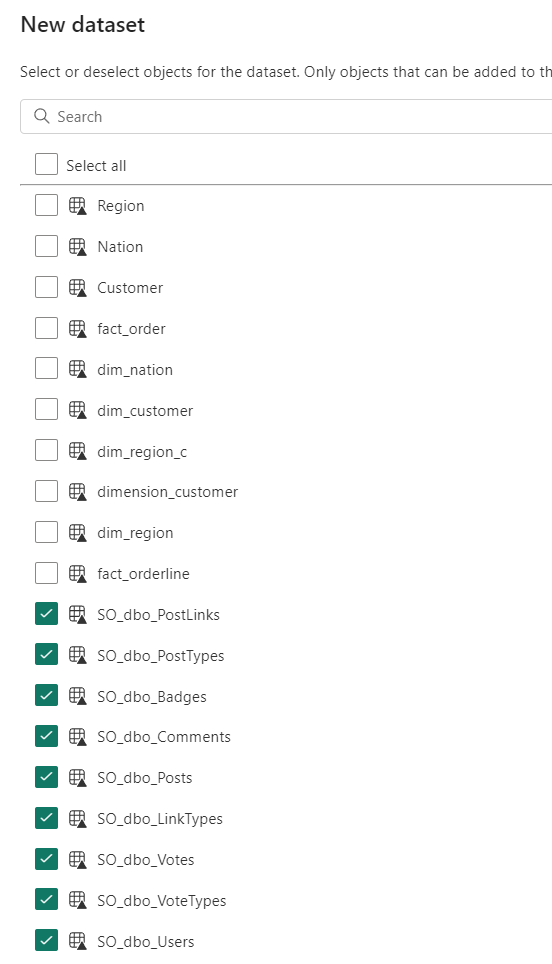
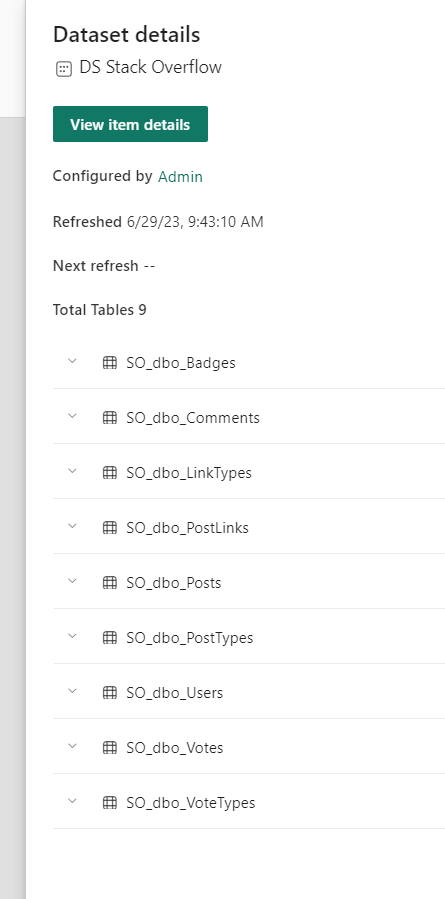
In my Lakehouse, I can create a new Dataset for my amazing report. Just because I can, I selected all the SO tables.
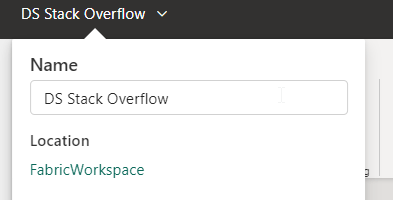
After creating all the relations and renaming the dataset (you can do this by clicking on the name in the top left corner where it enables you to change the name)
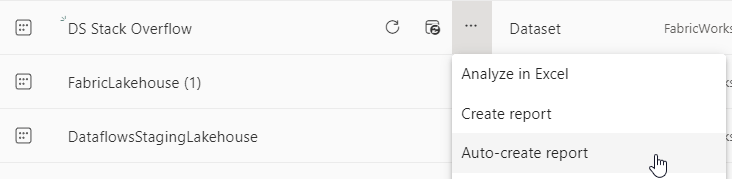
Autocreate report
All done, I’m going back to my workspace(!), click on my newly created dataset and:
Let’s see what happens!
And this is the result.
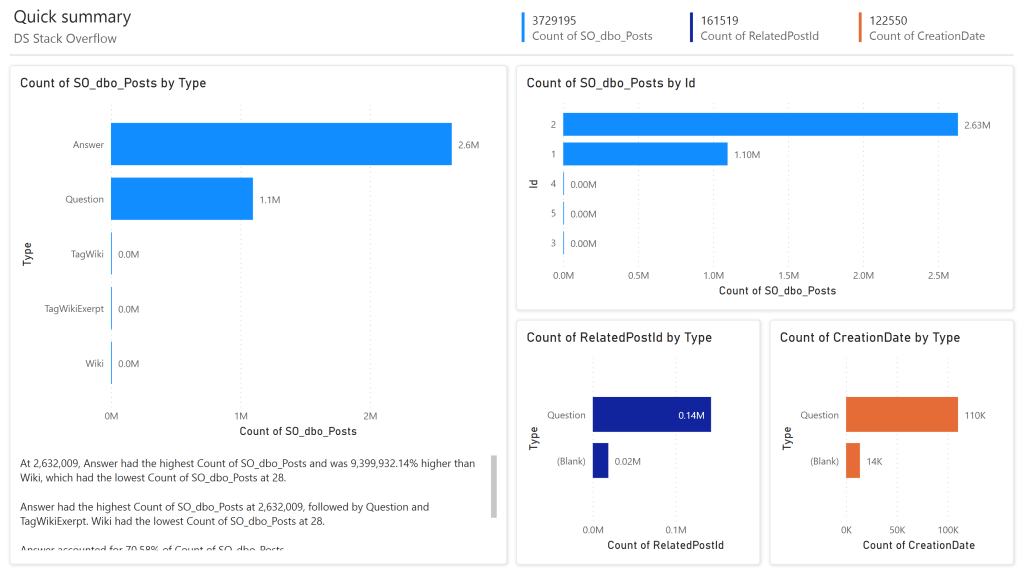
I love the one in the lower right hand corner, Count of creation date by type. And it’s easy to make fun of the auto-generated report, then again it provides first insights into your data and from this point on, you can change whatever you need to build your own report.
Lineage
Yes, there is automated lineage as well, though not as detailed as I’d hoped.
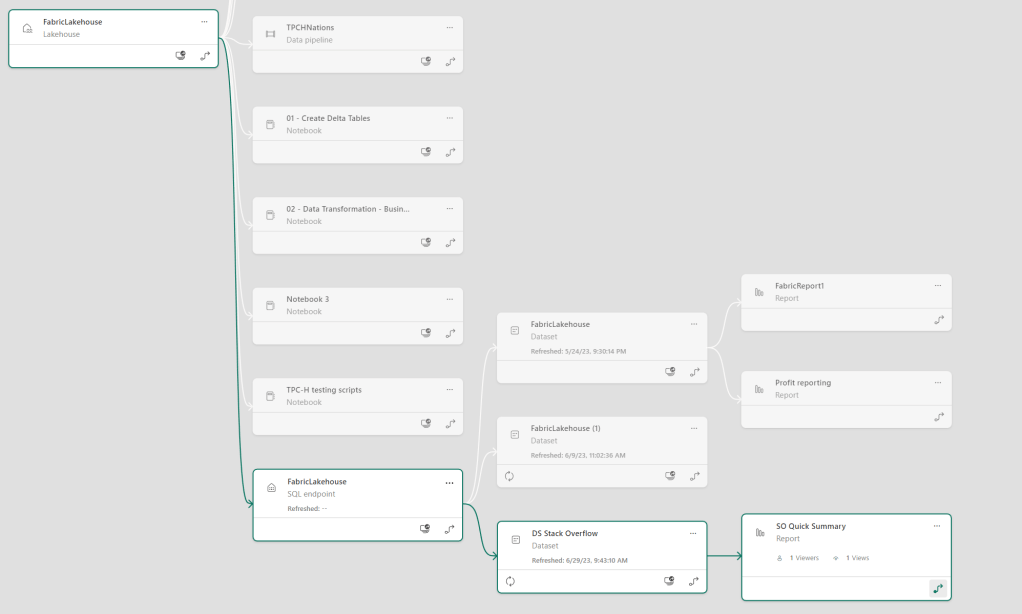
What I’d hoped is that I’d see some details on table level or even on the report level where measures are coming from. Something to dig deeper into at a later time; maybe I’m missing something. When you click on an item, you do get a summary of what’s in the dataset for example. Seeing the lineage of these individual items would be much appreciated.
Having an impact analysis on this high level is already useful as it helps to show where a part is being used. Again, table level information would really help.
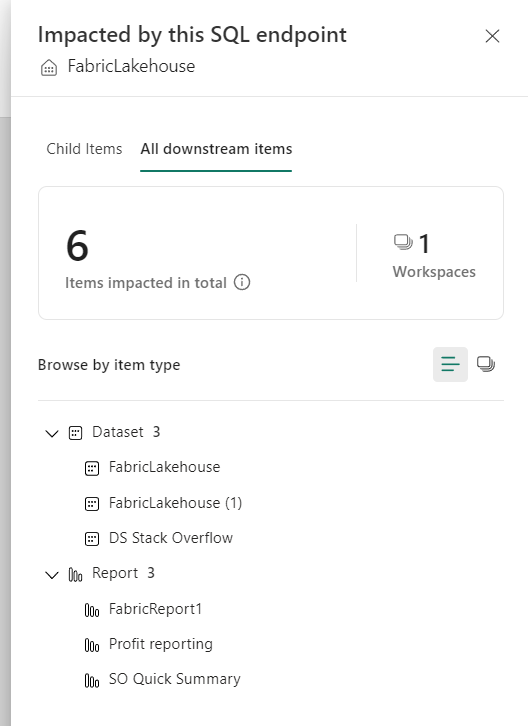
At least I can see the impact a change on the SQL enpoint has on downstream items, I can do the same on the Dataset.
Changes to a workspace or dataset
Something really nice that I found when checking out the impact was this button at the bottom left corner:
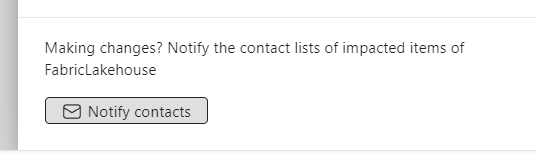
When I clicked it, this was the message:
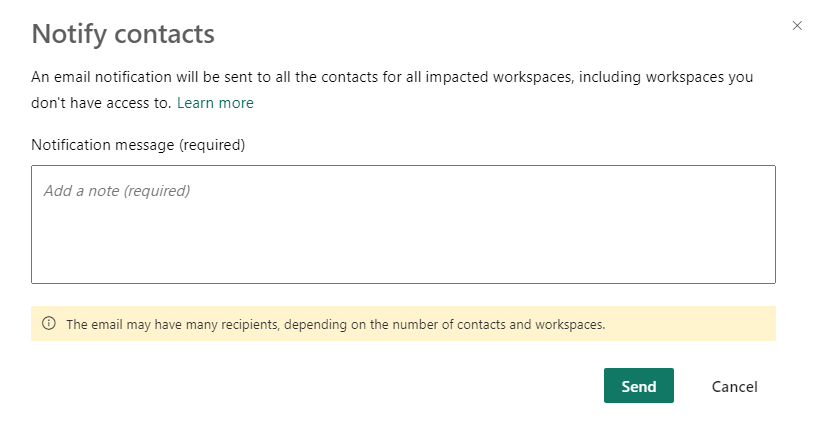
If I’m going to make a change, people using this will get an email. I’m sure they’ll love my message coming in at around 4PM on a friday ;).
Conclusion
How much time did this take?
- Checking the connection to my database and finding the firewall rule blocking traffic: 1 hour
- Creating the pipeline and ingesting the data: 10 minutes
- Ingesting the data (and getting coffee): 5 minutes
- Creating the data set and getting the relations working: 15 minutes
- Building the report: 3 minutes
If you really know what you’re doing, you can create your report from your on-premises SQL instance within an hour (network, datavolume permitting).
Of course, you could achieve the same result in ADF with a bit of Synapse and PowerBI. But, not in one pane. Not with all the connections in place without a click (source database is the exclusion of course). Not with the lineage in place without any additional configuration. And probably not without extra work to notify users of changes.
Finally, there are a lot of bloggers way more qualified than me to explain stuff on Data Factory, Purview or PowerBI. Please visit their blogs as well to get a better working knowledge on how these tools work.
Thanks for reading and again, please comment with your thoughts or, even better, experiences!

One thought on “Microsoft Fabric, connect to your on-premises SQL Server”